We read with interest the article by Aranceta-Bartrina et al.,1 whose objective was “to describe the prevalences of overall obesity and abdominal obesity in a representative sample of the Spanish population”.
We presume that the authors’ true objective was to describe not the prevalence of obesity in the sample, but rather the true prevalence of obesity in the Spanish population. To do so, they selected a sample of 3966 individuals, ensuring it was representative, and then used it to calculate the percentage of individuals with obesity. To extrapolate these results to the Spanish population, they calculated 95% confidence intervals.
Frequentist statistics based on significance tests, confidence intervals, and hypothesis testing are widely used nowadays. The main advantages of this approach are its simplicity and easy reproducibility, as many of the calculations can be done manually. The main disadvantage is that it does not provide a rational answer to clinical questions. The original question, “What is the true prevalence of obesity in the Spanish population?” cannot be answered intelligibly using this type of statistics.
The authors1 state that the rate of obesity was 21.6% (95% confidence interval, 19.0%-24.2%). To understand this interval, one must imagine taking repeated samples using the same model, such that in 95% of those samples, the intervals include the true population value.2 Although difficult to understand, this does not mean that there is a 95% probability that the prevalence of obesity in the Spanish population is between 19% and 24.2%; therefore, it does not address the original question.
Bayesian statistics are an alternative to frequentist statistics. The Bayesian approach is more complex and may require Markov chain Monte Carlo simulations,2,3 but it has the advantage of intuitively answering questions such as this one and it takes existing knowledge into account. Instead of “confidence intervals”, it uses “credible intervals”. The credible interval is the range in which there is a 95% probability of finding, for example, the true population value.
This type of statistics is based on Bayes theorem. It uses prior probability, along with experience or observation, to calculate the a posteriori probability. This means that each new study is seen not as separate or independent from existing knowledge, but as adding new information and contributing to the creation of new knowledge; this then serves as a starting point for subsequent studies.2
Reading this article, one is reminded of the 2012 publication by Gutiérrez-Fisac et al.,4 whose objective was also to describe the prevalence of obesity in Spain by studying 12 883 individuals. According to the data provided, the prevalence of obesity in persons aged between 18 and 64 years in their sample was 19.78%. If Bayesian statistics were used, it would then take these data as existing information to subsequently obtain deeper knowledge by calculating the credible interval.
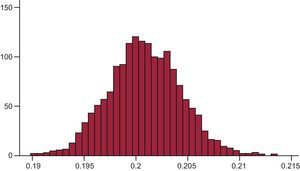
In this approach, for example, if one takes a beta distribution as the a priori probability of obesity (1 898.7700),4 with the variable obesity and a Bernoulli distribution, and if one then adds the data obtained by Aranceta-Bartrina et al.,1 after 12 500 iterations and a burn-in period of 2500, one would obtain an a posteriori obesity prevalence of 20.1% with a 95% credible interval of 19.4% to 20.8%. That is, this time there would indeed be a 95% probability that the overall prevalence of obesity in Spain is between 19.4% and 20.8%. The Figure shows a histogram representing the distribution of obesity according to Markov chain Monte Carlo simulations.

This coincides almost exactly with the confidence interval provided by Aranceta-Bartrina et al.1 (19%-24.2%), because when studies are similar in design, the confidence interval and the credible interval tend to be similar,2 although this is not necessarily the case. If Bayesian statistics are not used, there are 2 options: pay attention to only 1 of the studies and ignore the other (even if the methodology of both is appropriate) or conduct a third study that generates more evidence and acts as a “tie breaker”, even in the knowledge that it will not answer the original question.