A significant number of patients with acute myocardial infarction (AMI) are readmitted after hospital discharge, which produces a major impact on health care costs.1 Because some of these readmissions can be a sign of deficient inpatient care2 and many could potentially be preventable, a better understanding of them is worthwhile.3 In fact, readmission rates are a significant component of current quality improvement strategies.
In a previous study, we analyzed cardiac disease readmission rates after AMI based on the discharge data set of the Spanish national health system.4 In this letter, we present a subanalysis focused on differences in readmission rates between ST-segment elevation myocardial infarction (STEMI) and non–ST-elevation acute myocardial infarction (NSTEMI).
The methodology has been described in our previous publication.4 In brief, through the minimum basic data set of hospital discharges of the Spanish national health system, a total of 33 538 patients with at least 1-year of follow-up were identified: 18 189 patients (54.2%) with STEMI (codes 410.*1, except 410.71) and 15 349 patients (48.5%) with NSTEMI (code 410.71 for NSTEMI). Hospital risk standardized readmission rates were calculated using a multilevel model.
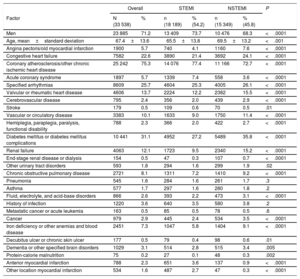
The patients’ characteristics are displayed in Table 1. Readmission rates were 4.7% at 30 days, 8.1% at 3 months and 18.1% at 1 year for STEMI and 6.3% at 30 days, 10.8% at 3 months and 22.7% at 1 year for NSTEMI (P<.001 for all comparisons). The risk standardized readmission rates at 30 days, 3 months, and 1 year were slightly lower in patients with STEMI than in those with NSTEMI (17.3%±4.7% vs 18.5%±4.7% at 1 year; P<.001). At 1 year, mortality from cardiac disease (1.5% vs 2.7%; P<.001) and the risk of developing heart failure (24.8% vs 28.8%; P<.001) were also lower in STEMI than in NSTEMI patients.
Baseline Characteristics of STEMI and NSTEMI Patients and Differences Between Them
| Overall | STEMI | NSTEMI | P | ||||
|---|---|---|---|---|---|---|---|
| Factor | N (33 538) | % | n (18 189) | % (54.2) | n (15 349) | % (45.8) | |
| Men | 23 885 | 71.2 | 13 409 | 73.7 | 10 476 | 68.3 | <.0001 |
| Age, mean±standard deviation | 67.4±13.6 | 65.5±13.8 | 69.5±13.2 | <.001 | |||
| Angina pectoris/old myocardial infarction | 1900 | 5.7 | 740 | 4.1 | 1160 | 7.6 | <.0001 |
| Congestive heart failure | 7582 | 22.6 | 3890 | 21.4 | 3692 | 24.1 | <.0001 |
| Coronary atherosclerosis/other chronic ischemic heart disease | 25 242 | 75.3 | 14 076 | 77.4 | 11 166 | 72.7 | <.0001 |
| Acute coronary syndrome | 1897 | 5.7 | 1339 | 7.4 | 558 | 3.6 | <.0001 |
| Specified arrhythmias | 8609 | 25.7 | 4604 | 25.3 | 4005 | 26.1 | <.0001 |
| Valvular or rheumatic heart disease | 4606 | 13.7 | 2224 | 12.2 | 2382 | 15.5 | <.0001 |
| Cerebrovascular disease | 795 | 2.4 | 356 | 2.0 | 439 | 2.9 | <.0001 |
| Stroke | 179 | 0.5 | 109 | 0.6 | 70 | 0.5 | .01 |
| Vascular or circulatory disease | 3383 | 10.1 | 1633 | 9.0 | 1750 | 11.4 | <.0001 |
| Hemiplegia, paraplegia, paralysis, functional disability | 788 | 2.3 | 366 | 2.0 | 422 | 2.7 | <.0001 |
| Diabetes mellitus or diabetes mellitus complications | 10 441 | 31.1 | 4952 | 27.2 | 5489 | 35.8 | <.0001 |
| Renal failure | 4063 | 12.1 | 1723 | 9.5 | 2340 | 15.2 | <.0001 |
| End-stage renal disease or dialysis | 154 | 0.5 | 47 | 0.3 | 107 | 0.7 | <.0001 |
| Other urinary tract disorders | 593 | 1.8 | 294 | 1.6 | 299 | 1.9 | .02 |
| Chronic obstructive pulmonary disease | 2721 | 8.1 | 1311 | 7.2 | 1410 | 9.2 | <.0001 |
| Pneumonia | 545 | 1.6 | 284 | 1.6 | 261 | 1.7 | .3 |
| Asthma | 577 | 1.7 | 297 | 1.6 | 280 | 1.8 | .2 |
| Fluid, electrolyte, and acid-base disorders | 866 | 2.6 | 393 | 2.2 | 473 | 3.1 | <.0001 |
| History of infection | 1220 | 3.6 | 640 | 3.5 | 580 | 3.8 | .2 |
| Metastatic cancer or acute leukemia | 163 | 0.5 | 85 | 0.5 | 78 | 0.5 | .6 |
| Cancer | 979 | 2.9 | 445 | 2.4 | 534 | 3.5 | <.0001 |
| Iron deficiency or other anemias and blood disease | 2451 | 7.3 | 1047 | 5.8 | 1404 | 9.1 | <.0001 |
| Decubitus ulcer or chronic skin ulcer | 177 | 0.5 | 79 | 0.4 | 98 | 0.6 | .01 |
| Dementia or other specified brain disorders | 1029 | 3.1 | 514 | 2.8 | 515 | 3.4 | .005 |
| Protein-calorie malnutrition | 75 | 0.2 | 27 | 0.1 | 48 | 0.3 | .002 |
| Anterior myocardial infarction | 788 | 2.3 | 651 | 3.6 | 137 | 0.9 | <.0001 |
| Other location myocardial infarction | 534 | 1.6 | 487 | 2.7 | 47 | 0.3 | <.0001 |
NSTEMI, non–ST-elevation acute myocardial infarction; STEMI, ST-segment elevation myocardial infarction.
Significant differences in readmission rates among the different types of hospitals were observed both in STEMI and NSTEMI patients, with lower rates in hospitals treating more patients (> 204 AMI discharges) (25% vs 19% for STEMI; 31,5% vs 29% for NSTEMI, at 1 year; P<.001) and with a cardiac catheterization laboratory (only for STEMI).
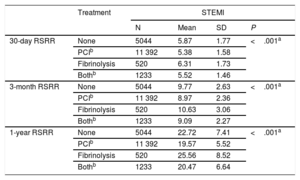
Lower readmission rates were noted in STEMI patients treated with percutaneous coronary intervention (PCI) in their index episode (Table 2), as well as in NSTEMI patients (7.2% at 30 days, 13.4% at 3 months, and 27.5% at 1 year with PCI, and 7.4% at 30 days, 14.2% at 3 months, and 28.7% at 1 year without revascularization treatment (P<.001, for all comparisons). A significant difference was observed between the risk standardized readmission rates depending on the medical unit responsible for attending the AMI, with cardiac units (5.4% at 30 days, 9.1% at 3 months, and 20.1% at 1 year for STEMI and 7.2% at 30 days, 13.5% at 3 months, and 27.8% at 1 year for NSTEMI) having fewer readmissions than other medical services (6.1% at 30 days, 10.2% at 3 months, and 23.2% at 1 year for STEMI and 7.7% at 30 days, 14.9% at 3 months, and 29.3% at 1 year for NSTEMI; P<.001, for all comparisons).
Readmission Rates by Type of Treatment Received in STEMI
| Treatment | STEMI | ||||
|---|---|---|---|---|---|
| N | Mean | SD | P | ||
| 30-day RSRR | None | 5044 | 5.87 | 1.77 | <.001a |
| PCIb | 11 392 | 5.38 | 1.58 | ||
| Fibrinolysis | 520 | 6.31 | 1.73 | ||
| Bothb | 1233 | 5.52 | 1.46 | ||
| 3-month RSRR | None | 5044 | 9.77 | 2.63 | <.001a |
| PCIb | 11 392 | 8.97 | 2.36 | ||
| Fibrinolysis | 520 | 10.63 | 3.06 | ||
| Bothb | 1233 | 9.09 | 2.27 | ||
| 1-year RSRR | None | 5044 | 22.72 | 7.41 | <.001a |
| PCIb | 11 392 | 19.57 | 5.52 | ||
| Fibrinolysis | 520 | 25.56 | 8.52 | ||
| Bothb | 1233 | 20.47 | 6.64 | ||
PCI, percutaneous coronary intervention; RSRR, risk standardized readmission rates; SD, standard deviation; STEMI, ST-segment elevation myocardial infarction.
We analyzed only those readmissions related to cardiac disease instead of all-cause readmissions in order to focus more on those most related to the index admission, as suggested by Southern et al.5
This study has several limitations. Despite being a retrospective analysis, the use of administrative records to estimate outcomes in health services has been validated, and it is currently applied by other authors. The model developed by Medicare & Medicaid Services was used in this study. With respect to the adjustment models, there are confounding factors that are impossible to identify, but which may have a significant impact. Nevertheless, the models used in this study compare favorably against models published elsewhere in terms of their predictive capacity.
This study demonstrates that, within the Spanish national health system, the probability of readmission in the short- and mid-term and the presence of death and heart failure at 1 year are higher after NSTEMI than after STEMI. Furthermore, readmission rates in both types of AMI were associated with some characteristics of the hospital, as well as with discharge from the cardiology unit and the performance of PCI during the index hospitalization. Significant interregional and interhospital differences in managing AMI have been observed in Spain.6 Whereas patients with STEMI usually undergo emergent revascularization, the therapeutic strategy in NSTEMI is extremely variable and, in most cases, patients do not undergo coronary angiography at the times recommended in the guidelines. Our findings may suggest that NSTEMI patients can also benefit from the use of care networks that favor PCI and the participation of cardiology services with sufficiently large caseloads.
FUNDINGThe work for this paper was funded by unconditional grants from Fundación Interhospitalaria para Investigación Cardiovascular and Laboratorios Menarini S.L. (RECALCAR Project).
.
The authors thank the Spanish Ministry of Health, Social Services, and Equality for the help provided to the Spanish Society of Cardiology to develop the RECALCAR study, with special gratitude to the General Directorate of Public Health, Quality, and Innovation.