
The comprehensive geriatric assessment (CGA) exhibits a robust association with prognosis in patients with acute coronary syndrome (ACS). Furthermore, a differential impact has been described for some treatments, depending on geriatric profile.1 Unfortunately, CGA information is not available for many patients during the acute phase of ACS.
Adjusted morbidity groups (AMGs) are an indicator of morbidity based on patient diagnoses and health care needs, taking into account mortality, primary care visits, risk of hospitalization, and prescriptions, among others.2 This indicator has shown a strong association with prognosis,3 although there is no information on any correlation with CGA scores in elderly patients with ACS.
The purpose of this study was to describe the distribution of AMG weights and their association with CGA scores in older patients admitted due to ACS.
A prospective observational registry was created to include consecutive patients aged ≥75years admitted due to ACS (non–ST-segment elevation acute myocardial infarction, ST-segment elevation acute myocardial infarction, or unstable angina). Exclusion criteria included patient refusal to participate and the impossibility to obtain a CGA score. Patient status prior to hospitalization was determined by CGA, and frailty was assessed using the FRAIL scale. Additionally, functional capacity for basic activities of daily living was assessed by the Barthel index, instrumental activities by the Lawton-Brody scale, cognitive status by the Pfeiffer test, and comorbidity by the Charlson index. Nutritional risk was evaluated by the MNA–SF (Mini Nutritional Assessment–Short Form) test. Patients were treated at the discretion of the medical team according to current guidelines. All patients or their representatives signed an informed consent form before recruitment.
The association between AMG and CGA scores were analyzed as follows: a) AMG weight was taken as a continuous variable, and its correlation with CGA scores was analyzed by the Pearson coefficient, and b) the proportion of frailty, disability, comorbidity burden, nutritional risk, and cognitive status in the various AMG distribution quintiles was analyzed for the series. The association between categorical variables was analyzed by the chi-square test, correcting for continuity if necessary. Quantitative variables were analyzed by ANOVA. All analyses were performed using PASW Statistics 18 (PASW Statistics, United States).
Among the 191 patients, 188 (98.4%) had AMG weights available and were included in the analyses. The other 3 patients were transfer patients and had no information in the system.
Mean age was 81.9 years (SD=4.7). Table 1 contains an overall description of the sample. In all, 67 (35.6%) patients were prefrail and 42 (22.3%) were frail. Additionally, 48 patients (25.5%) had some degree of cognitive impairment, 57 (30.3%) were at risk of malnutrition, and 14 (7.4%) were moderately or severely dependent.
Overall description of the sample and association between geriatric syndromes and AMG weights
| Baseline clinical characteristics and geriatric assessmentn=188 | |
|---|---|
| Age, y | 81.9 (4.7) |
| Sex, men | 102 (54.3) |
| Hypertension | 157 (83.5) |
| Diabetes mellitus | 86 (45.7) |
| Dyslipidemia | 133 (70.7) |
| Active smoker | 8 (4.3) |
| Peripheral artery disease | 42 (22.3) |
| History of stroke | 27 (14.4) |
| History of myocardial infarction | 44 (23.4) |
| History of heart failure | 23 (12.2) |
| Killip class ≥ II on admission | 59 (31.9) |
| Elevated troponin | 174 (92.6) |
| Hemoglobin on admission, g/dL | 14.8 (4) |
| Creatinine clearance on admission, mL/min | 56 (15) |
| Left ventricular ejection fraction, % | 53 (11) |
| Coronary angiography during hospitalization | 160 (85.1) |
| Multivessel disease | 87 (54.3) |
| Main trunk injury | 17 (10.6) |
| Complete revascularization | 69 (36.7) |
| Charlson index | 1.98 (1.8) |
| FRAIL scale | |
| Robust | 79 (42) |
| Prefrail | 67 (35.6) |
| Frail | 42 (22.3) |
| Barthel index | |
| Independent | 143 (76.1) |
| Slightly dependent | 31 (16.5) |
| Moderately or severely dependent | 14 (7.4) |
| Lawton-Brody index | 6.31 (2.5) |
| Nutritional risk (MNA <11) | 57 (30.3) |
| Pfeiffer test | |
| Normal | 140 (74.5) |
| Moderate cognitive impairment | 44 (23.4) |
| Severe cognitive impairment | 4 (2.1) |
| Geriatric profile according to AMG quintile | ||||||
|---|---|---|---|---|---|---|
| Quintile 1(n=37) | Quintile 2(n=37) | Quintile 3(n=36) | Quintile 4(n=39) | Quintile 5(n=39) | P | |
| Age, y | 81.5 (5) | 83.7 (6) | 82.2 (4) | 82.5 (4) | 82.2 (4) | .349 |
| Sex, men | 19 (51.4) | 19 (51.4) | 22 (61.1) | 23 (59) | 19 (48.7) | .939 |
| Geriatric syndromes | ||||||
| Charlson | 0.65 (0.6) | 1.5 (1.5) | 1.86 (1.7) | 2.59 (1.8) | 3.13 (3) | <.001 |
| Barthel | 98.5 (4) | 91.5 (16) | 92.5 (14) | 92.7 (14) | 86.3 (22) | .018 |
| Lawton-Brody | 7.4 (1.4) | 6.3 (2.7) | 6.4 (2.5) | 6.3 (2.5) | 5.1 (2.7) | .002 |
| FRAIL | <.001 | |||||
| Robust | 23 (62.2%) | 15 (40.5) | 15 (41.7%) | 16 (41%) | 10 (25.6%) | |
| Prefrail | 14 (37.8%) | 12 (32.4%) | 15 (41.7%) | 12 (30.8%) | 14 (35.9%) | |
| Frail | 0 | 10 (27%) | 6 (16.7%) | 11 (28.2%) | 15 (38.5%) | |
| Pfeiffer errors | 1.3 (1.3) | 1.8 (2) | 0.9 (1) | 1.7 (2) | 2.3 (2.2) | .025 |
| MNA-SF score | 12.5 (1) | 11.9 (1.6) | 11.9 (1.4) | 11.5 (2.5) | 10.5 (2.6) | <.001 |
AMG, adjusted morbidity group; MNA, Mini Nutritional Assessment; MNA–SF, Mini Nutritional Assessment–Short Form.
Data are expressed as no. (%).
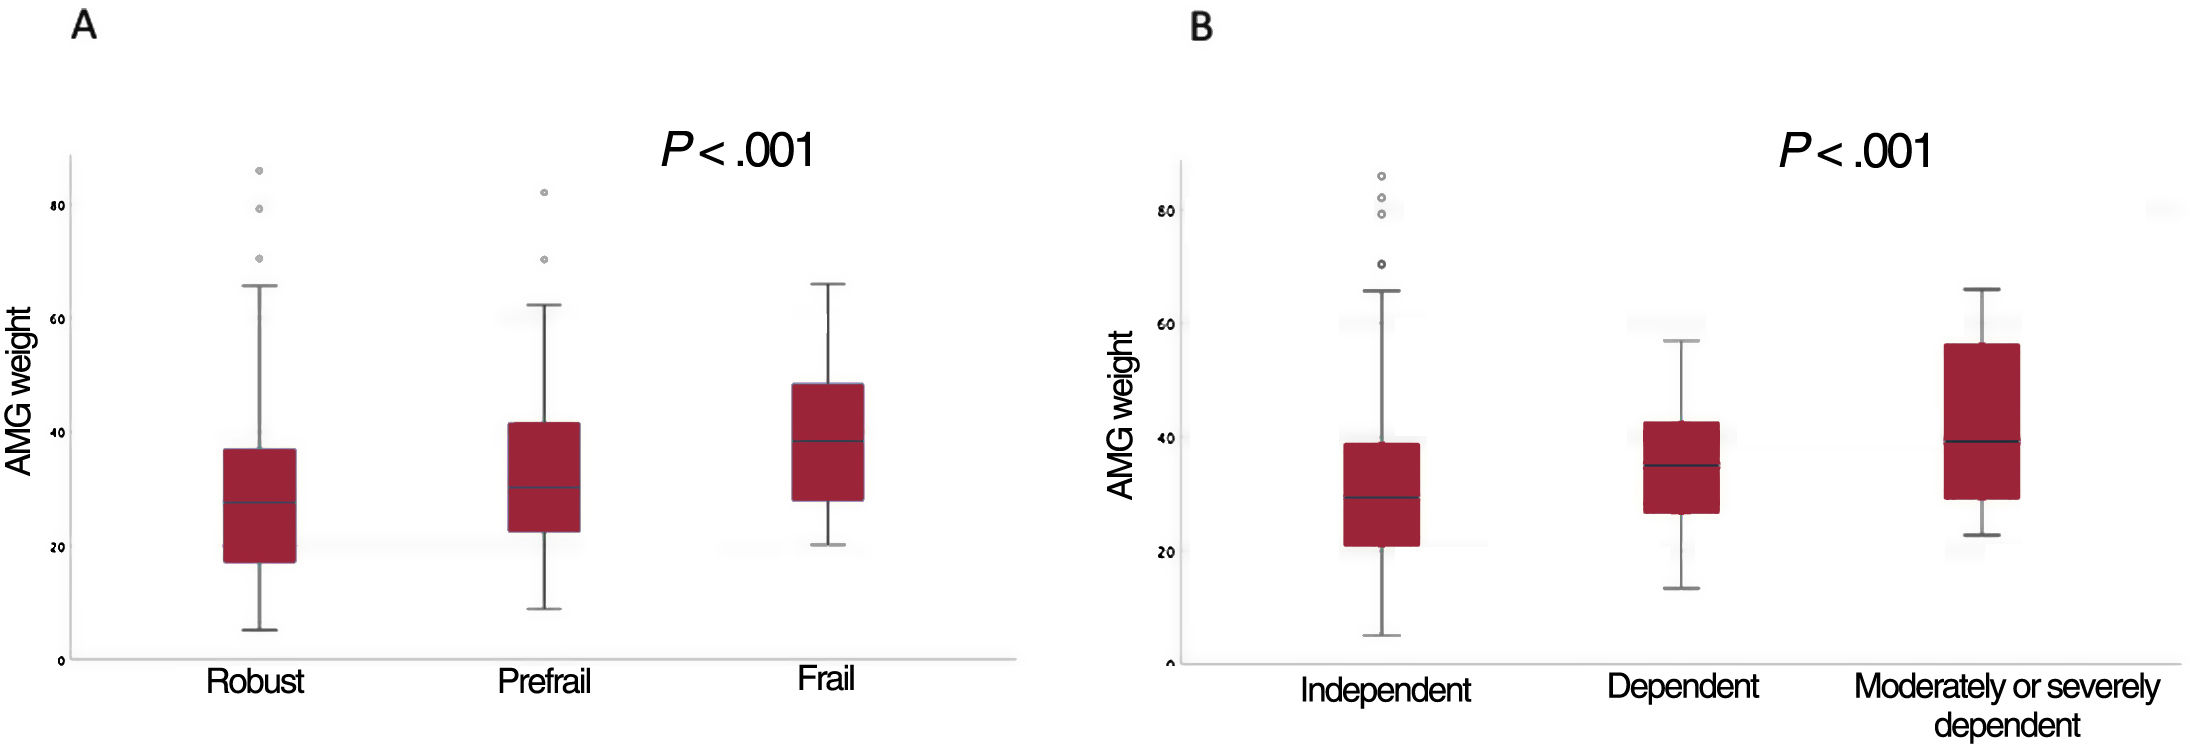
Mean AMG was 32.8 (SD=15.4). No age- or sex-related differences were observed between the various AMG categories. Conversely, a rising prevalence of frailty, disability, cognitive impairment, nutritional risk, and comorbidity burden was observed in the quintiles of higher AMGs (table 1). A strong correlation was observed between AMG weight and all CGA components (Charlson index: r=0.467; P<.001; Barthel index r=0.222; P<.002; Barthel index r=0.247; P<.001; Pfeiffer test r=0.155; P<.034; MNA-SF test: r=0.281; P<.001; FRAIL scale: r=0.279; P<.001). Figure 1 shows the distribution of AMG weights between the various frailty categories and the functional status for basic activities of daily living.
 and functional status for basic activities of daily living by the Barthel index (B) in elderly patients with acute coronary syndrome. AMG, adjusted morbidity group.")
AMG weight is an indicator of multiple morbidities and complexity that is calculated from the patient's previous diagnoses and from factors related to use of the health system. This indicator is available for the vast majority of patients seen in our setting.
The data from this study show a strong association between AMG and the various components of the CGA. A higher comorbidity burden and a higher prevalence of disability, frailty, cognitive impairment, and nutritional risk were observed in the higher AMG categories. The strong correlation between AMG weight and the CGA components, which are robust prognostic predictors of ACS, suggests that AMG may be useful in the risk stratification of elderly patients with ACS.
This study had several relevant limitations, for instance, the observational design, lack of a specific approach toward sex-related variables according to the SAGER guidelines, and the limited sample size. Consequently, this study focused on work to develop a hypothesis on the relationship between AMG weight and the components of the CGA.
In any case, AMG should not be used instead of the CGA, even though it may have similar predictive performance in this setting. Nevertheless, the usefulness of AMG should be analyzed in larger studies to evaluate its prognostic value directly.
FUNDINGThis project was funded by the Department of Health of the Generalitat de Catalunya (Strategic Plan for Health Research and Innovation [PERIS], 2016-2020). SLT006/17/00080 (18DPS008).
ETHICAL CONSIDERATIONSThe study protocol was reviewed and approved by the reference clinical research ethics committee (Hospital Universitario of Bellvitge, IRB00005523). Informed consent was appropriately obtained from all patients prior to study enrollment and kept on file. A specific sex-based approach was not taken according to the SAGER guidelines.
STATEMENT ON THE USE OF ARTIFICIAL INTELLIGENCENo artificial intelligence tool was used.
AUTHOR CONTRIBUTIONSA. Ariza-Solé and F. Formiga contributed to the study conception, data analysis, and the writing of this article. E. Calvo contributed to data collection and article revision. J. Comín-Colet, D. Monterde, and E. Vela contributed to critical review of the manuscript.
CONFLICTS OF INTERESTD. Monterde and E. Vela are developers of the AMG tool. There are no other potential conflicts of interest.