ISSN: 1885-5857 Impact factor 2024 4.9
Vol. 78. Num. 10.
Pages 838-847 (October 2025)

Original article
Advanced echocardiography and cluster analysis to identify secondary tricuspid regurgitation phenogroups at different risk

Ecocardiografía avanzada y análisis de conglomerados para identificar fenogrupos de insuficiencia tricuspídea secundaria con diferente riesgo

Luigi P. BadanoabMarco PensoaMichele TomaselliaKyu KimcAlexandra ClementdNoela RaduaGeu-Ru HongcDiana R. HădăreanueAlexandra ButafCaterina DelceafSamantha FisicaroaGianfranco ParatiabChi Young ShimcDenisa Muraruab
Rev Esp Cardiol. 2025;78:848-910.1016/j.rec.2025.03.011
Covadonga Fernández-Golfín, Ana García-Martín
https://doi.org/10.1016/j.rec.2025.02.004

Options

Supplementary data
Imagen extra
Rev Esp Cardiol. 2025;78:838-47
Abstract
Introduction and objectives

Significant secondary tricuspid regurgitation (STR) is associated with poor prognosis, but its heterogeneity makes predicting patient outcomes challenging. Our objective was to identify STR prognostic phenogroups.

Methods

We analyzed 758 patients with moderate-to-severe STR: 558 (74±14 years, 55% women) in the derivation cohort and 200 (73±12 years, 60% women) in the external validation cohort. The primary endpoint was a composite of heart failure hospitalization and all-cause mortality.
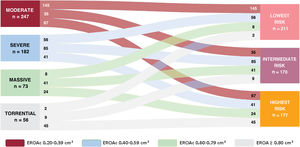
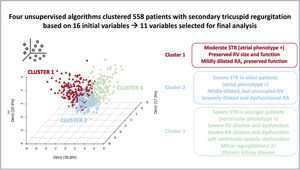
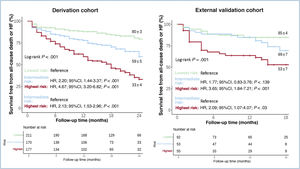
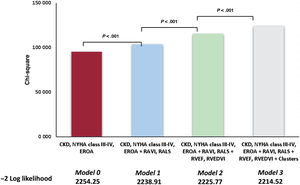
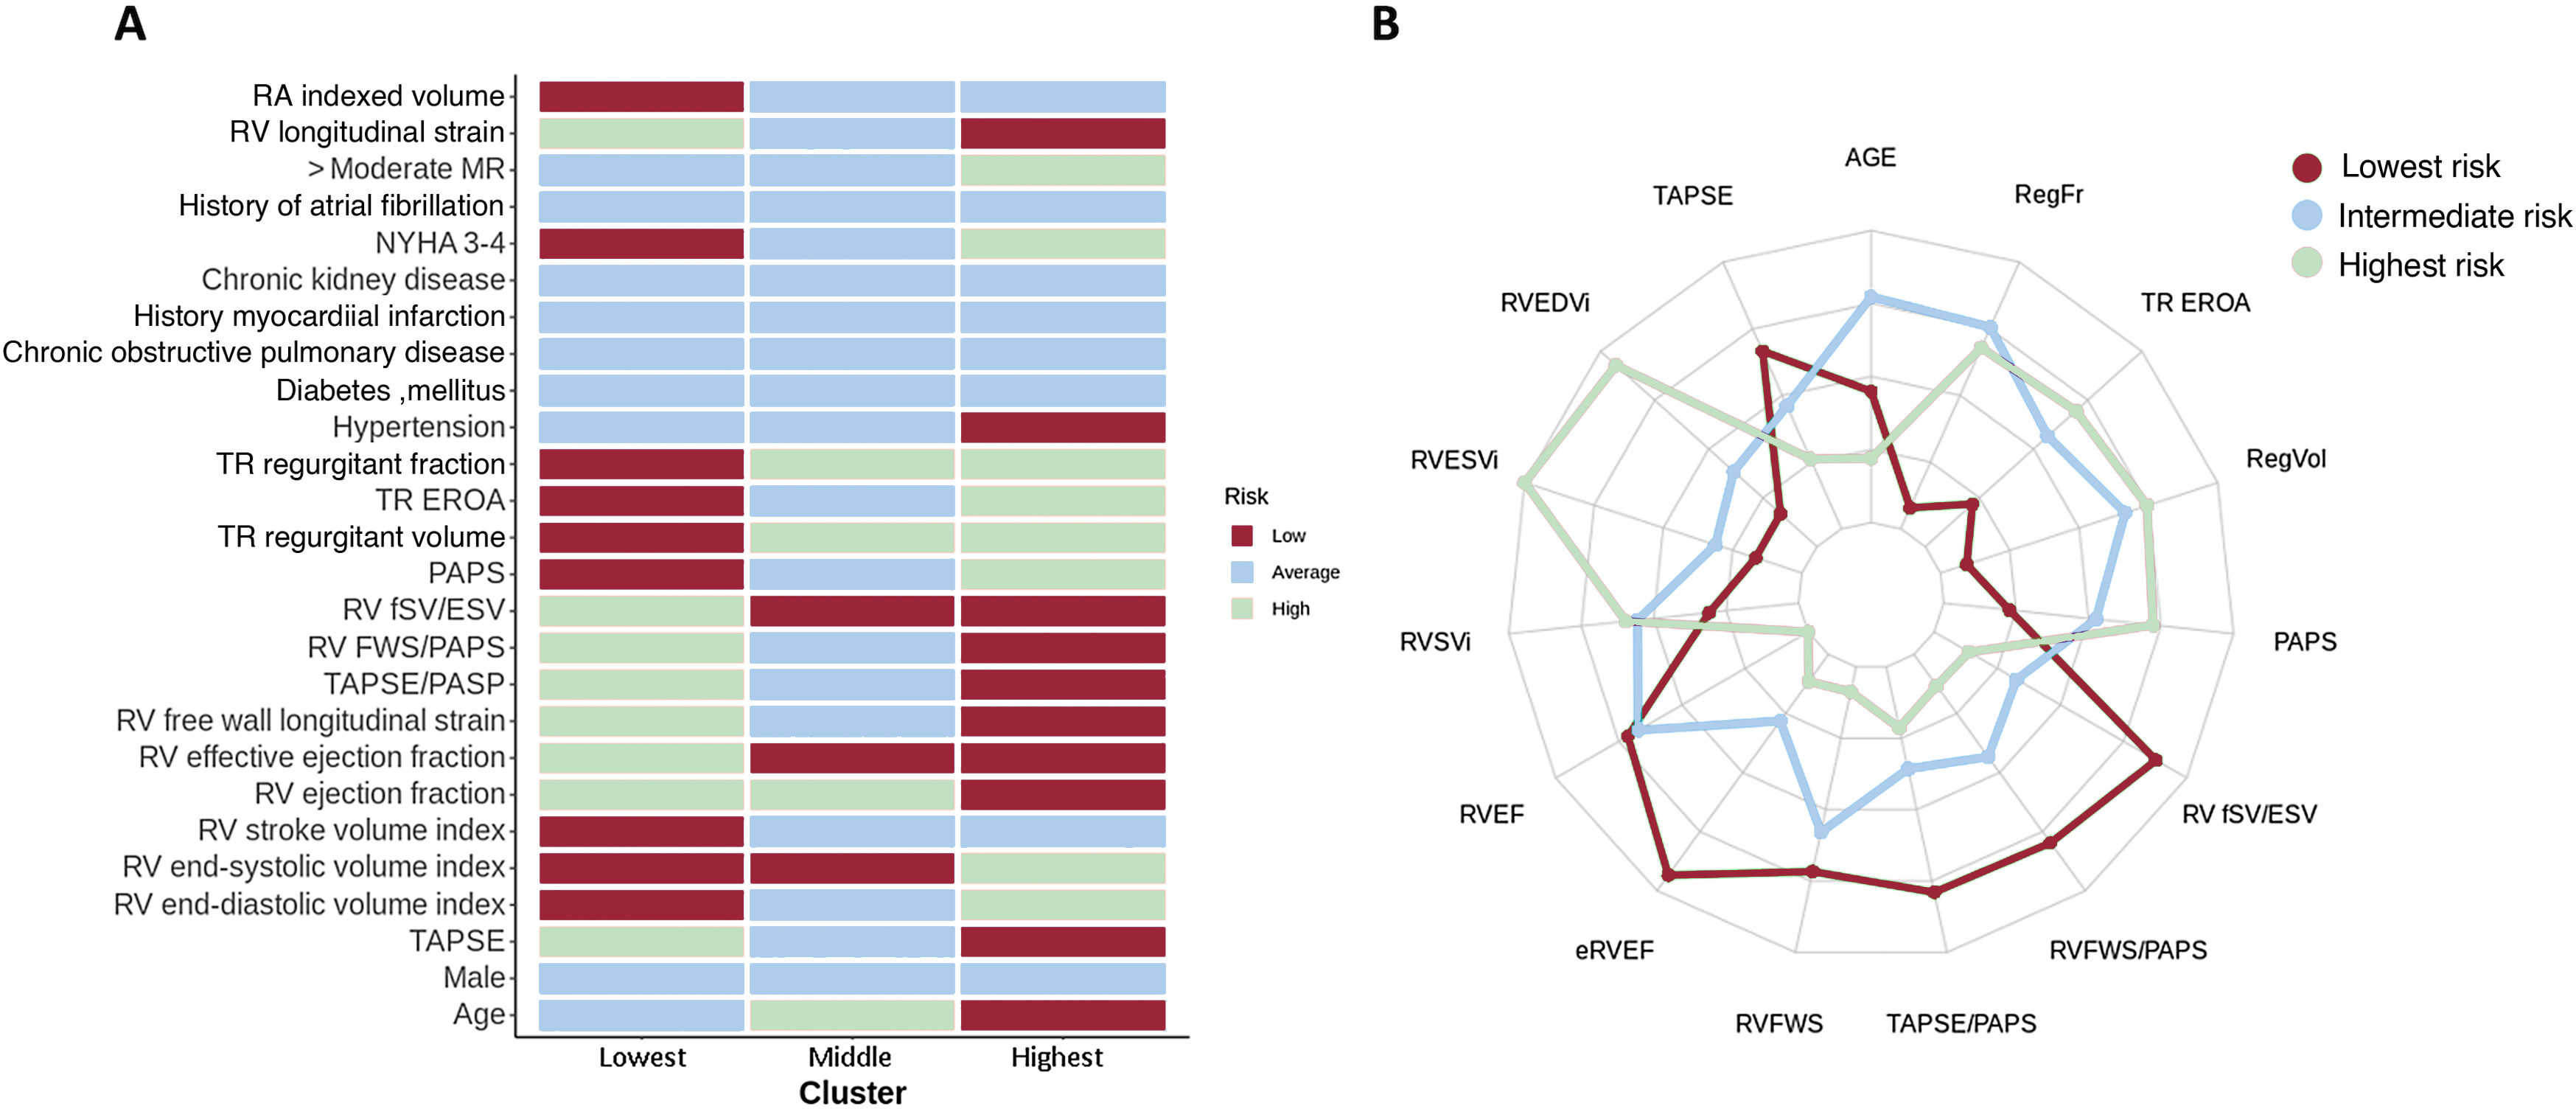
Results

We identified 3 phenogroups. The low-risk phenogroup (2-year event-free survival 80%, 95%CI, 74%-87%) had moderate STR, preserved right ventricular (RV) size and function, and a moderately dilated but normally functioning right atrium. The intermediate-risk phenogroup (HR, 2.20; 95%CI, 1.44-3.37; P<.001) included older patients with severe STR, and a mildly dilated but uncoupled RV. The high-risk phenogroup (HR, 4.67; 95%CI, 3.20-6.82; P<.001) included younger patients with massive-to-torrential tricuspid regurgitation, as well as severely dilated and dysfunctional RV and right atrium. Multivariable analysis confirmed the clustering as independently associated with the composite endpoint (HR, 1.40; 95%CI, 1.13-1.70; P=.002). A supervised machine learning model, developed to assist clinicians in assigning patients to the 3 phenogroups, demonstrated excellent performance both in the derivation cohort (accuracy=0.91, precision=0.91, recall=0.91, and F1 score=0.91) and in the validation cohort (accuracy=0.80, precision=0.78, recall=0.78, and F1 score=0.77).

Conclusions

The unsupervised cluster analysis identified 3 risk phenogroups, which could assist clinicians in developing more personalized treatment and follow-up strategies for STR patients.

Keywords

Secondary tricuspid regurgitation
Unsupervised cluster analysis
Phenogroups
Outcomes
Machine learning
3-dimensional echocardiography
Speckle-tracking echocardiography
INTRODUCTION

Secondary tricuspid regurgitation (STR) is associated with reduced survival and impaired quality of life.1 However, STR is not a single condition. It encompasses at least 2 phenotypes: ventricular STR and atrial STR, each with distinct etiologies, mechanisms, natural histories, and responses to treatment.2–6 In addition to the STR phenotype and severity, other factors—such as age, sex, symptoms (New York Heart Association [NYHA] class and signs of right-sided heart failure), liver and kidney function, and the extent of right heart chamber remodeling—contribute to determining the prognosis of patients with STR.7,8 Moreover, several retrospective studies have shown that patients with moderate STR are also at increased risk of events,9 and the size and function of the right ventricle (RV) and right atrium (RA) are associated with outcomes.10–17Several scores7,18,19 and cluster analyses20–23 have been developed to predict all-cause death and hospitalization due to heart failure (HHF) in patients with STR. Most studies have reported RV size and function by visual assessment22 or conventional echocardiography as key factors associated with outcomes. Due to the peculiar shape of the RV and the position of the right heart in the mediastinum, parameters of RV size (linear dimensions and cavity areas) and function (tricuspid annular plane systolic excursion and fractional area change), as well as RA size (area or volume), obtained from 2-dimensional and M-mode echocardiography, have only moderate correlations with the same parameters measured by cardiac magnetic resonance in patients with STR.24 Moreover, certain parameters, such as the basal RV diameter may overestimate RV size in patients with atrial STR.25 Conversely, 3-dimensional echocardiography RV volumes and ejection fraction, as well as RV free-wall longitudinal strain obtained from dedicated RV-focused apical views, have been shown to be accurate when compared with cardiac magnetic resonance,26–28 and are associated with all-cause death and HHF in patients with STR.12–17,29,30

Accordingly, we included the parameters obtained from advanced echocardiography in a database containing patients’ demographic, laboratory, and clinical data, as well as quantitative assessment of the severity of STR to explore whether unsupervised cluster analysis could identify phenogroups of patients with STR, who have significantly different clinical risk of events during follow-up.

METHODSStudy population

The derivation cohort was obtained from a retrospective analysis of echocardiographic examinations prospectively collected between October 2020 and March 2022 (FUTURE 3D. ClinicalTrials.gov Identifier: NCT05747404). We included consecutive patients over 18 years of age with moderate-to-severe STR, good acoustic windows, complete echocardiographic studies, and a minimum follow-up period of 6 months. Exclusion criteria included primary tricuspid regurgitation (TR), cardiac implantable electronic device-related TR, previous surgical or transcatheter tricuspid valve (TV) interventions, pregnancy, inadequate echocardiographic images, and lack of follow-up data. For external validation, we included a cohort of patients prospectively enrolled at Yonsei University College of Medicine, Seoul, South Korea, between January 2022 and February 2024, adhering to the same inclusion and exclusion criteria. Patients with STR were classified into atrial or ventricular phenotypes according to recent recommendations.6,8

This retrospective analysis was approved by the Ethics Committee of our Institute (record #2021_05_18_13, approved on May 18, 2021). Patients’ informed consent was obtained and archived for the publication of their cases. The investigation conforms to the principles outlined in the Declaration of Helsinki.

Phenogroup variable selection and clustering

A set of 16 variables, derived from demographic or echocardiographic domains routinely obtained for the assessment of STR severity or with proven prognostic value, were considered as candidates for analysis (). To determine the optimal number of covariates and eliminate redundant information among the variables, those with poor representation in the first 4 dimensions of principal component analysis—defined by squared cosine values and a correlation coefficient >0.8—were filtered out.

To identify the optimal number of phenogroups within the study cohort, the elbow method was used, with the total within the sum of squares serving as the metric. Unsupervised clustering was performed using 3 methods: a partitioning method (K-means), a hierarchical method (agglomerative; balanced iterative reducing and clustering hierarchies [BIRCH]), and a model-based clustering method (Gaussian mixture model).

For internal validation, commonly used cluster validity analysis indexes—including Silhouette, Davies-Bouldin, Dunn, and S-Dbw, which combine measures of cluster compactness and separation—were evaluated to determine the optimal clustering technique and the number of clusters in the final solution. The optimal unsupervised clustering technique was identified as the one with the highest Silhouette and Dunn indexes and the lowest Davies-Bouldin and S-Dbw indexes. The cluster labels were then used as input for supervised machine learning.

Supervised machine learning to assign patients to the STR phenogroups

We developed a machine learning model using XGBoost (a gradient boosting tree-based algorithm, ) to predict the differential phenogroups of individual participants. The goal was to assist clinicians in identifying the risk profile and prognosis of STR in each patient. Twelve routinely available variables were selected as inputs for the machine learning algorithm (). We evaluated the model's performance using balanced accuracy, macro precision, macro recall, and macro F1-score (). We used the SHAP (SHapley Additive exPlanations) interpretability method to determine the importance of ranking features from the model's predictive output and to provide an explanation for individual phenogroup predictions (). As part of the internal validation, which involves running the model in a randomly-selected portion of study cohort, a Monte Carlo cross-validation with 100 iterations was carried out.

Statistical analysis

One-way ANOVA, chi-squared, or Fisher exact tests were used, as appropriate, to compare the distribution of continuous and categorical variables between phenogroups. Continuous variables were summarized as means±standard deviation or medians [interquartile range (IQR)], while categorical variables were summarized as frequencies and percentages. The data were standardized to remove differences in variable scales, although the original forms were retained for interpretation. Pearson correlation coefficients were calculated to analyze collinearity.

To visualize differences in parameters between the phenogroups, we generated a heatmap and used a radar plot to illustrate echocardiographic characteristics across phenogroups. The risk of the composite study endpoint among phenogroups was assessed using time-to-event analysis (Kaplan-Meier method) with the log-rank test. Cox proportional hazards models were used to estimate hazard ratios (HR) between phenogroups, with results presented as HR and 95% confidence intervals (95%CI).

The multivariable model was adjusted for NYHA class, presence of chronic kidney dysfunction (CKD), effective regurgitant orifice area, and RA and RV volume and function. Variables were selected for multivariable analysis based on their clinical significance (ie, known risk factors) and their significant association with outcomes in univariable analysis. To address the competing risk of all-cause death, the Fine-Gray competing risk regression model was applied, and subdistribution HRs (sHR) with 95%CIs were provided.

We used the likelihood ratio test and changes in the C-index, calculated with the DeLong test, the integrated discrimination improvement, and continuous net reclassification index to determine the improved prognostic performance of the model with the inclusion of the phenogroup variable. Additionally, we assessed the incremental prognostic value of the identified phenogroups over known clinical and echocardiographic parameters using the chi-squared Omnibus test of model coefficients. The statistical analysis was performed using Python version 3.10.12 and R version 4.3.2 (details of the packages used are provided in ).

RESULTSBaseline characteristics

A total of 558 and 200 patients were included in our derivation and validation cohorts, respectively (, ). No patient underwent surgical/transcatheter TV interventions during the study period.

Clustering analysis

Eleven out of the 16 discriminatory variables were used in the unsupervised cluster analysis ().

The first 4 dimensions of a principal component analysis accounted for 72.7% of the total variance in the dataset. According to the results from the elbow method, the optimal number of clusters was 3. K-means clustering was selected as the best algorithm for clustering based on validity indices.

Table 1 and figure 1 show the clinical and echocardiographic differences among the patients in the derivation cohort included in the 3 phenogroups. There was a large overlap of TR severity among the patients included in the 3 phenogroups (figure 2)

Table 1.

Comparisons of demographic, clinical and echocardiographic variables among patients in the lowest-, intermediate-, and highest-risk phenogroup

Parameter  Lowest risk(n=211)  Intermediate risk(n=170)  Highest risk(n=177)  P 
Age, y  73±12  81±8a  67±16a,b  <.001 
Male sex, %  92 (44)  70 (41)  91 (51)  .130 
Hypertension, %  120 (57)  109 (64)  71 (40) a,b  <.001 
Diabetes mellitus, %  38 (18)  24 (14)  39 (22)  .160 
COPD, %  21 (10)  19 (11.2)  30 (17) a  .095 
Previous myocardial infarction, %  33 (15)  24 (14)  48 (27) a,b  .003 
Previous heart valve surgery, %  18 (9)  23 (14)  17 (10)  .259 
Severe CKD, %  45 (21)  53 (31) a  72 (41) a  <.001 
NYHA        <.001 
82 (39)  37 (22)  7 (4)   
II  92 (44)  87 (51)  85 (48)   
III  37 (17)  44 (26)  72 (41)   
IV  0 (0)  2 (1)  13 (7)   
Atrial fibrillation, %  99 (47)  114 (67) a  89 (50) b  <.001 
Mitral regurgitation ≥ 2+  36 (17)  51 (30) a  70 (40) a,b  <.001 
Right atrial longitudinal strain, %  19 [11-35]  12 [8-18] a  10 [6-17] a,b  <.001 
Right atrial volume, mL/m2  40 [27-53]  53 [40-68] a  53 [38-76] a  <.001 
Secondary tricuspid regurgitation etiology        <.001 
Ventricular  83 (39)  67 (39)  149 (84) a,b   
Atrial  128 (60)  103 (61)  28 (16)   
TAPSE, mm  19±17±4 a  15±4 a,b  <.001 
RV end-diastolic volume, mL/m2  68±18  81±20 a  114±32 a,b  <.001 
RV end-systolic volume, mL/m2  30±11  37±12 a  68±24 a,b  <.001 
RV SV, mL/m2  38±11  44±11 a  45±16 a  <.001 
Left ventricular ejection fraction, %  52±14  53±11  41±16 a,b  <.001 
RV ejection fraction, %  56±10  55±40±9 a,b  <.001 
Effective RV ejection fraction, %  34±11  19±7 a  15±8 a,b  <.001 
RV FWS, %  22.2±6.6  20.3±5.1 a  13.6±5.9 a,b  <.001 
TAPSE/PASP, mm/mmHg  0.58±0.24  0.40±0.13 a  0.34±0.16 a,b  <.001 
RV FWS/PASP, %/mmHg  0.67±0.28  0.48±0.14 a  0.32±0.22 a,b  <.001 
RV forward SV/ESV  0.87±0.39  0.46±0.24 a  0.32±0.20 a,b  <.001 
PASP, mmHg  36±11  45±13 a  51±20a,b  <.001 
Regurgitant volume, mL  26±13  49±11 a  52±24 a  <.001 
Effective regurgitant orifice area, cm2  0.32±0.17  0.53±0.15 a  0.61±0.45 a,b  <.001 
Regurgitant fraction, %  39±17  66±13 a  63±19 a  <.001 

COPD, chronic obstructive pulmonary disease; CKD, chronic kidney dysfunction; FWS, free-wall longitudinal strain; NYHA, New York Heart Association; PASP, pulmonary artery systolic pressure; RV, right ventricle; SV, stroke volume; TAPSE, tricuspid annular plane systolic excursion.

Values are expressed as mean±standard deviation, median [interquartile range] or No. (%).

The P values depict differences between:

a

vs low risk;

b

vs intermediate risk.

Figure 1.

Differences in clinical and echocardiographic variables among the lowest-, intermediate, and highest-risk phenogroups. A, heatmap of phenotypic characteristics across the selected clusters. Data are given as color-coded standard deviations from the mean after centering and scaling. B, the radar chart depicting the echocardiographic features and age, highlights the differences among the clusters. The lines represent the cluster average values across the standardized features. EROA, effective regurgitant orifice area; ESV, end-systolic volume; fSV, forward stroke volume; FWS, free-wall longitudinal strain; MR, mitral regurgitation; NYHA, New York Heart Association; PASP, pulmonary artery systolic pressure; RA, right atrial; RV, right ventricular; TAPSE, tricuspid annular plane systolic excursion; TR, tricuspid regurgitation.

(0.37MB).
Figure 2.

Sankey plot showing the distribution of tricuspid severity grades among the 3 phenogroups. EROAc, corrected effective regurgitant orifice area.

(0.25MB).

The phenogroup at the lowest risk (with an incidence of 21.3% for the composite endpoint and 12.8% for both all-cause death and HHF at 2 years) included mildly symptomatic patients with predominantly moderate STR, a higher prevalence of atrial STR, a low prevalence of CKD, normal RV size and function, and mildly dilated RA with preserved function. Patients included in the intermediate-risk phenogroup had a higher incidence of the composite endpoint (32.9%), death (18.2%), and HHF (17.6%) than the previous phenogroup. They were the oldest and mildly symptomatic, with severe STR, a higher prevalence of atrial STR and atrial fibrillation (AF), and moderately dilated RV. Although conventional RV function indexes were normal, the RV-pulmonary artery coupling and the effective RV ejection fraction were borderline low. The RA was severely dilated and dysfunctional. Finally, patients in the highest-risk phenogroup (with an incidence of the composite endpoint, death, and HHF of 64.4%, 31.1%, and 42.9%, respectively) were the youngest and exhibited massive or torrential STR, along with the highest prevalence of ventricular STR. They also had a significantly higher prevalence of CKD, high pulmonary artery systolic pressure values, and severely dilated and dysfunctional RV and RA. In addition, high-risk STR patients had a significantly higher prevalence of left ventricular dysfunction and moderate or severe mitral regurgitation (figure 3).

Figure 3.

Central illustration. Characterization of 3 phenogroups of patients with secondary tricuspid regurgitation using unsupervised clustering analysis. RA, right atrium; RV, right ventricle; STR, secondary tricuspid regurgitation.

(0.41MB).
Association of phenogroups with clinical outcomes

After a median follow-up of 17 months [IQR 9-23], 215 patients in the derivation cohort reached the combined endpoint, which included 133 HHF and 113 deaths. The event-free survival was 76±2% after the first year and 58±3% after the second year of follow-up (, left panel). In the derivation and validation cohorts, 50% of events occurred within 502 and 432 days after the baseline echocardiogram, respectively (). The median time to survival was 20 months in the derivation cohort and 16 months in the validation cohort, respectively ().

The risk of adverse clinical events during follow-up significantly increased from the lowest- to the highest-risk phenogroup (P<.001 for all) (figure 4).

Figure 4.

Kaplan-Meier plots for the analysis of cumulative event-free survival of patients from the derivation (left panel) and validation (right panel) cohorts included in the lowest-, intermediate-, and highest-risk clusters. 95%CI, 95% confidence interval; HR, hazard ratio.

(0.36MB).

Compared with the lowest-risk phenogroup, patients in the intermediate-risk phenogroup doubled the risk of the composite endpoint (HR, 2.20; 95%CI, 1.44-3.37) and death (HR, 2.01; 95%CI, 1.15-3.53; P=.015). Similarly, patients in the highest-risk phenogroup had almost a 5-fold increased risk of experiencing the composite endpoint (HR, 4.67; 95%CI, 3.20-6.82), 4 times the risk of HHF (HR, 4.21; 95%CI, 2.68-6.62, and a 3-fold increased risk of death (HR, 2.98; 95%CI, 1.78-4.99) compared with those in the lowest-risk phenogroups (P<.001 for all) (figure 4, ). On multivariable analysis (adjusted for NYHA class >2, CKD, effective regurgitant orifice area, RV ejection fraction, RV end-diastolic volume index [RVEDVi], right atrial longitudinal strain [RALS], and right atrial maximal volume index), the phenogroup variable was independently associated with the composite endpoint (HR, 1.57; 95%CI, 1.23-2.0; P<.001, for each risk increase) (table 2, model 1). However, in the competing risk analysis, the cluster variable showed an sHR of 1.32; 95%CI, 0.97-1.78; P=.075).

Table 2.

Cox proportional hazard models of clinical and echocardiographic parameters to evaluate their association with the composite endpoint (heart failure hospitalization or all-cause death) in the derivation cohort

Models  UnadjustedHR (95%CI; PAdjustedHR (95%CI; PCompeting risksHR (95%CI; P
Model 1       
Clusters (per 1-stage increase)  2.13 (1.78-2.56; <.001)  1.57 (1.23-2.00; <.001)  1.32 (0.97-1.78; .075) 
CKD  2.25 (1.70-2.99; <.001)  1.74 (1.32-2.29; <.001)  2.17 (1.49-3.16; <.001) 
Effective regurgitant orifice area (per 0.1 cm2 increase)  1.11 (1.07-1.14; <.001)  1.05 (1.01-1.10; .010)  0.98 (0.92-1.03; .42) 
RV ejection fraction (per 1% increase)  0.96 (0.95-0.98; <.001)  0.99 (0.97-1.01; .336)  0.99 (0.96-1.02; .51) 
NYHA functional class ≥ III  2.05 (1.55-2.72; <.001)  1.42 (1.06-1.90; .02)  1.28 (0.96-1.71; .094) 
Right atrial volume indexed (per 1 mL/m2 increase)  1.01 (1.00-1.01; <.001)  1.00 (1.00-1.01; .102)  0.99 (0.99-1.00; .11) 
Right atrial longitudinal strain (per 1% increase)  0.96 (0.95-0.98; <.001)  0.99 (0.98-1.00; .214)  1.00 (0.97-1.01; .60) 
RV end-diastolic volume indexed (per 1 mL/m2 increase)  1.01 (1.01-1.02; <.001)  1.00 (0.99-1.00; .370)  1.00 (1.00-1.01; .62) 
Model 2       
Clusters (per 1-stage increase)  2.13 (1.78-2.56; <.001)  1.97 (1.63-2.40; <.001)  1.73 (1.37-2.18; <.001) 
TR severity (per 1 grade increase)  1.47 (1.29-1.67; <.001)  1.20 (1.05-1.37; .008)  0.89 (0.76-1.05; .16) 
Model 3       
Clusters (per 1-stage increase)  2.13 (1.78-2.56; <.001)  1.91 (1.59-2.29; <.001)  1.56 (1.24-1.96; <.001) 
Atrial STR  0.44 (0.30-0.66; <.001)  0.78 (0.51-1.21; .274)  0.79 (0.45-1.37; .400) 
Model 4       
Clusters (per 1-stage increase)  2.13 (1.78-2.56; <.001)  2.15 (1.79-2.58; <.001)  1.62 (1.30-2.03; <.001) 
Male sex  0.90 (0.68-1.19; .455)  0.84 (0.63-1.11; .216)  1.02 (0.70-1.48; .940) 

95%CI, 95% confidence interval; HR, hazard ratio; NYHA, New York Heart Association; RV, right ventricle; sHR, subdistribution HR; STR, secondary tricuspid regurgitation.

The additional prognostic value of the clustering analysis in patients with STR was further evaluated along with clinical parameters (NYHA class, CKD), STR severity, right atrial volume, RALS, RVEDVi, and RV ejection fraction, using hierarchical model chi-squared analysis (figure 5).

Figure 5.

Hierarchical Cox regression analysis showing the incremental clinical value of clusters. Model 0 was a multivariate basal model including clinical parameters and tricuspid regurgitation severity. New York Heart Association (NYHA) class III-IV, chronic kidney disease (CKD), and tricuspid regurgitation effective regurgitant orifice area. In model 1, we added right atrial volume (RAVI) and longitudinal strain (RALS) to model 0. In model 2, we added right ventricular volume (RVEDVI) and ejection fraction (RVEF) to model 1. Finally, in model 3 we added the 3 clusters to model 2.

(0.17MB).

Finally, the C-index for phenogroups for predicting the 2-year composite endpoint was 0.72 (95%CI, 0.68-0.76 at 2 years). When added to the multivariable model, as described above, there was a significant improvement in the model's goodness of fit (likelihood ratio χ2=15.9, P<.001) and discrimination statistic (change in C-index from 0.75 to 0.76, P by DeLong test=.048; integrated discrimination improvement=0.03, 95%CI, 0.007-0.059; P<.001; and reclassification net reclassification index=0.176, 95%CI, 0.044-0.29; P<.001).

The severity and etiology of TR were found to be independently predictive of the composite endpoint through Cox regression analysis. When adjusting for TR severity or atrial STR, the phenogroup remained a significant independent risk factor for the endpoint (table 2, models 2,3).

The composite endpoint occurred in 90 (42%) men and 125 (58%) women (). After adjusting for sex, the phenogroups were associated with a higher risk of the outcome (table 2, model 4). Furthermore, after adjusting for TR severity, the phenogroups remained independent predictors of the endpoint, in both men (HR, 1.95; 95%CI, 1.46-2.61; P<.001) and women (HR, 1.83; 95%CI, 1.45-2.31; P<.001).

External validation

During a median follow-up of 15 months [IQR 7-17], patients in the external validation cohort experienced 27 deaths and 27 HHF. Kaplan-Meier analysis at 18 months showed that cluster 3 in the validation cohort had significantly lower event-free survival rates compared with clusters 1 and 2 (figure 4, ).

Supervised machine learning to enhance clinical utility

The patients were split randomly into training (70%) and test (30%) sets, ensuring an equal distribution of events in both sets. The machine learning model (figure 6) demonstrated excellent clinical performance both in the derivation test set (accuracy=0.91, precision=0.91, recall=0.91, and F1 score=0.91) and in the external validation cohort (accuracy=0.80, precision=0.78, recall=0.78, F1 score=0.77) ().

Figure 6.

This analysis uses data obtained from 2 patients to illustrate the predictions made by the machine learning model via a force plot. Features contributing positively to predicting the phenogroup are highlighted in red, while those indicating that a patient will not belong to that phenogroup are shown in blue. The size of the arrows represents the relative impact of each feature on the model's predictions. EROA, effective regurgitant orifice area; ESV, end-systolic volume; fSV, forward stroke volume; PASP, pulmonary artery systolic pressure; RALS, right atrial longitudinal strain; RAVI, right atrial maximal volume index;RegFr, regurgitant fraction; RV, right ventricular; RVEDVi, right ventricular end-diastolic volume index; RVEF, right ventricular ejection fraction; TAPSE, tricuspid annular plane systolic excursion; TR, tricuspid regurgitation.

(0.22MB).

Similar results were observed from the stability analysis, with the model achieving a mean accuracy, precision, recall, and F1 score of 87%, with a 95%CI, of 86-87% across Monte Carlo cross-validation ().

The impact of the included parameters on the model's ability to predict inclusion in a specific phenogroup is shown in .

DISCUSSION

The current classification of TR into primary, atrial STR, ventricular STR, and cardiac implantable electronic device-related is based on the pathophysiological mechanisms of TR and does not consider clinical parameters and comorbidities that may be associated with adverse outcomes. Moreover, the RA and RV remodeling parameters used in these classifications were obtained with conventional echocardiography and are heavily dependent on shape and geometric assumptions and do not account for the volume and pressure overload of the RV.6,8 With the exponential increase in TV interventions (particularly transcatheter) and their debatable impact on outcomes,7 clinicians need to characterize patients with at least moderate STR, identify those who are at increased risk of events, and refer those who will benefit most to early surgical or transcatheter intervention.

Unsupervised cluster analysis provides an unbiased approach to look holistically at clinical, RV, and RA geometry and function, and STR severity variables. Accordingly, we used unsupervised clustering analysis to categorize patients with moderate-to-severe STR based on the severity of TR and the size and function of their RV and RA as measured by advanced echocardiography.28,31–33 Our phenogroup characterization is similar to that reported by Vely et al.23 Like theirs, our patients included in the lowest-risk phenogroup resemble the characteristics of atrial STR, and those included in the highest-risk phenogroup were mostly ventricular STR with dysfunctional RV and RA. However, our clustering algorithms did not select the categorization of the patients in atrial and ventricular STR to assign patients to a specific phenogroup. Indeed, 39% of patients in the lowest-risk phenogroup were categorized as ventricular STR, and 16% of patients in the highest-risk phenogroup were atrial STR.6,8 This is a sign of the objective difficulty in making a dichotomous distinction between atrial and ventricular STR in many patients because of the variable progression of RA and RV remodeling in individual patients and because, in more advanced stages of the disease, both phenotypes may overlap in terms of RA and RV geometry and function. Although the patients in the lowest-risk phenogroup are not currently considered for TV repair procedures, their disease is not benign since they have an incidence of the composite endpoint of 21.3% and mortality of 12.8% at 2 years. This confirms the findings that moderate STR is not benign, as previously considered.9 Considering their very low surgical risk, these patients can be closely monitored and referred for surgery as soon as either the TR worsens or RV remodeling progresses.7,34

The computation of advanced echocardiographic indexes of RV and RA geometry and function allowed us to provide a more detailed characterization of patients in the intermediate-risk phenogroup. These patients had severe STR, but the RV was not significantly dilated. When using conventional echocardiography indexes of RV function (ie, tricuspid annular plane systolic excursion, RV ejection fraction, and RV free-wall longitudinal strain), their RV function appeared normal. According to current recommendations, these patients are not typically considered for surgical or transcatheter treatment.8 However, compared with the patients in the lowest-risk phenogroup, they had a 2-fold increase in the composite endpoint of cardiac death and HHF at 2 years. The distinctive characteristic of these patients is subtle RV dysfunction, which can only be identified using RV function measures that adjust for RV volume and pressure overload, such as the effective RV ejection fraction and measures of RV-PA coupling12 obtained through 3-dimensional echocardiography. Additionally, these patients also had severely dilated and dysfunctional RA.13,15,16

Anand et al.21 conducted a cluster analysis of 13 611 patients with moderate-to-severe primary and secondary TR. Due to limited quantitative parameters of TR severity, RA and RV size and function, and no classification of the etiology of TR, they mainly relied on qualitative echocardiographic and clinical variables to identify 5 clusters: low-risk TR (few comorbidities and less severe TR), high-risk TR (more comorbidities, larger RV, and more congestive HF), TR associated with lung disease, TR associated with ischemic cardiomyopathy, and TR associated with CKD. The 5 clusters were associated with significant differences in survival even after adjusting for the qualitative assessment of the degree of TR. Like our results, Anand et al. found that the patients at highest risk of death were the youngest, and those at intermediate risk were the oldest.

Similar findings were reported by Rao et al.20 Among 2379 patients categorized by TR etiology (primary, secondary, and cardiac implantable electronic device-related), they identified 4 clusters, with the youngest patients, who had heart failure and liver and kidney dysfunction, showing the highest cumulative incidence of death and HHF. Conversely, the oldest patients without HF and with normal kidney function had the best outcomes. They found that unsupervised machine learning algorithms were unable to identify distinct clusters with different prognoses based on baseline characteristics. However, except for pulmonary artery systolic pressure, all the other parameters of RV size and function, RA size, and TR severity were only qualitative.20

Clinical implications

In addition to the severity of STR, it is important to consider RV and RA remodeling, patient age, and kidney function when stratifying the risk and managing patients with moderate-to-severe STR. Our results highlight the clinical heterogeneity in cardiovascular risk among these patients which is primarily associated with different extents of RA and/or RV remodeling, going beyond the current atrial and ventricular STR classification. Unlike previous studies,23 we were able to translate the results of the clustering analysis into a clinically applicable model that accurately predicts the STR patient phenogroup and assists clinicians in identifying patients in the intermediate-risk phenogroup. Although these patients do not have an indication for valve repair according to current guidelines, they exhibited a 59% incidence of either death or HHF at the 2-year follow-up.

Study limitations

This study is an observational and retrospective analysis that utilizes prospectively collected data, which inherently comes with limitations due to its design. Additionally, 11% of the echocardiographic studies were of poor quality, and 8% of the patients were lost to follow-up. These factors may have introduced selection bias and affected the generalizability of our findings. Following the T-VARC recommendations, we used all-cause mortality as the endpoint.35 Issues related to missing data prevented us from including some important biomarkers such as N-terminal pro-B-type natriuretic peptide and troponin.

CONCLUSIONS

Three phenogroups of patients with moderate-to-severe STR, each with distinct characteristics and different risks of experiencing death or HHF, were identified. Patients with severe TR, dilated and dysfunctional RA, and subclinical RV systolic dysfunction should be considered for closer follow-up and early referral for valve repair.

FUNDING

This study was supported by the Italian Ministry of Health - Ricerca Finalizzata (Grant # RF-202112374122)

ETHICAL CONSIDERATIONS

This retrospective analysis was approved by the Ethics Committee of our Institute (record #2021_05_18_13, approved on May 18, 2021). Patients’ informed consent was obtained and archived for the publication of their cases. The investigation conforms with the principles outlined in the Declaration of Helsinki. SAGER guidelines were followed with respect to possible sex/gender bias.

STATEMENT ON THE USE OF ARTIFICIAL INTELLIGENCE

No generative artificial intelligence or artificial intelligence-assisted technologies were used to write this paper.

AUTHORS’ CONTRIBUTIONS

L.P. Badano and M. Penso contributed equally to the paper. All authors have contributed significantly to the submitted work. L.P. Badano designed the study, interpreted the results, drafted the manuscript, and approved the final manuscript. M. Penso participated in the study design, performed the statistical and clustering analysis, and developed the machine learning model. M. Tomaselli designed the study, interpreted the results, and critically revised the manuscript for important intellectual content. A. Clement performed basic and advanced echocardiographic measurements, interpreted the results, and critically revised the manuscript for important intellectual content. N. Radu performed basic and advanced echocardiographic measurements, interpreted the results, and critically revised the manuscript for important intellectual content. D.R. Hădăreanu critically revised the manuscript for important intellectual content. A. Buta organized the database and critically revised the manuscript for important intellectual content. C. Delcea critically revised the manuscript for important intellectual content. S. Fisicaro collected most of the echocardiographic studies and critically revised the manuscript for important intellectual content. K. Kim provided the data for the external validation and critically revised the manuscript for important intellectual content. C. Young Shim critically revised the manuscript for important intellectual content. G.-R. Hong critically revised the manuscript for important intellectual content. G. Parati critically revised the manuscript for important intellectual content. D. Muraru contributed to the conception of the study, interpretation of the results, and critically revised the manuscript for important intellectual content.

CONFLICTS OF INTEREST

D. Muraru and L.P. Badano are members of the speaker bureaus of GE Healthcare and Philips Medical Systems, and received research grants from GE Healthcare, Philips Medical Systems, TomTec Imaging Systems, and ESaOTE SpA. A. Clement and M. Tomaselli received research grants from Philips Medical Systems. The remaining authors have nothing to disclose.

WHAT IS KNOWN ABOUT THE TOPIC?

  • -

    The current classification of tricuspid regurgitation (TR) into primary, atrial secondary, ventricular secondary, and cardiac implantable electronic device-related is based on the pathophysiological mechanisms of TR and does not consider clinical or blood test parameters that may be associated with adverse outcomes.

  • -

    The RA and ventricular remodeling parameters used in current classifications of TR are obtained with conventional echocardiography that do not account for right ventricular volume and pressure overload.

  • -

    There is a need to characterize patients with at least moderate secondary TR, identify those who are at increased risk of events, and refer those who will benefit most to early treatment.

WHAT DOES THIS STUDY ADD?

  • -

    Using unsupervised cluster analysis based on clinical and advanced echocardiographic variables, we identified 3 distinct phenogroups of patients with moderate-to-severe secondary TR associated with significantly different risks of the occurrence of a composite endpoint of death or hospitalization for heart failure.

  • -

    Advanced echocardiographic techniques and parameters that normalize right ventricular function for the volume overload allowed us to identify subclinical right ventricular dysfunction and right atrial dysfunction as characterizing the intermediate-risk phenogroup.

References
[1]
R.T. Hahn.
Tricuspid Regurgitation.
New Engl J Med., (2023), 388 pp. 1876-1891
[2]
R.T. Hahn, L.P. Badano, P.E. Bartko, et al.
Tricuspid regurgitation: recent advances in understanding pathophysiology, severity grading and outcome.
Eur Heart J Cardiovasc Imaging., (2022), 23 pp. 913-929
[3]
M. Gavazzoni, F. Heilbron, L.P. Badano, et al.
The atrial secondary tricuspid regurgitation is associated to more favorable outcome than the ventricular phenotype.
Front Cardiovasc Med., (2022), 9 pp. 1022755
[4]
G. Russo, L.P. Badano, M. Adamo, et al.
Characteristics and outcomes of patients with atrial versus ventricular secondary tricuspid regurgitation undergoing tricuspid transcatheter edge-to-edge repair - Results from the TriValve registry.
Eur J Heart Fail., (2023), 25 pp. 2243-2251
[5]
X. Galloo, M.F. Dietz, F. Fortuni, et al.
Prognostic implications of atrial vs. ventricular functional tricuspid regurgitation.
Eur Heart J Cardiovasc Imaging., (2023), 24 pp. 733-741
[6]
D. Muraru, L.P. Badano, R.T. Hahn, et al.
Atrial secondary tricuspid regurgitation: pathophysiology, definition, diagnosis, and treatment.
Eur Heart J., (2024), 45 pp. 895-911
[7]
J. Dreyfus, X. Galloo, M. Taramasso, et al.
TRI-SCORE and benefit of intervention in patients with severe tricuspid regurgitation.
Eur Heart J., (2024), 45 pp. 586-597
[8]
R.T. Hahn, M.K. Lawlor, C.J. Davidson, et al.
Tricuspid Valve Academic Research Consortium Definitions for Tricuspid Regurgitation and Trial Endpoints.
Eur Heart J., (2023), 44 pp. 4508-4532
[9]
S. Offen, D. Playford, G. Strange, S. Stewart, D.S. Celermajer.
Adverse Prognostic Impact of Even Mild or Moderate Tricuspid Regurgitation: Insights from the National Echocardiography Database of Australia.
J Am Soc Echocardiogr., (2022), 35 pp. 810-817
[10]
M.F. Dietz, E.A. Prihadi, P. van der Bijl, et al.
Prognostic Implications of Right Ventricular Remodeling and Function in Patients With Significant Secondary Tricuspid Regurgitation.
Circulation., (2019), 140 pp. 836-845
[11]
E.A. Prihadi, P. van der Bijl, M. Dietz, et al.
Prognostic Implications of Right Ventricular Free Wall Longitudinal Strain in Patients With Significant Functional Tricuspid Regurgitation.
Circ Cardiovasc Imaging., (2019), 12 pp. e008666
[12]
M. Gavazzoni, L.P. Badano, A. Cascella, et al.
Clinical Value of a Novel Three-Dimensional Echocardiography-Derived Index of Right Ventricle-Pulmonary Artery Coupling in Tricuspid Regurgitation.
J Am Soc Echocardiogr., (2023), 36 pp. 1154-1166000
[13]
R. Hinojar, C. Fernandez-Golfin, A. Gonzalez Gomez, et al.
Clinical utility and prognostic value of right atrial function in severe tricuspid regurgitation: one more piece of the puzzle.
Eur Heart J Cardiovasc Imaging., (2023), 24 pp. 1092-1101
[14]
R. Hinojar, J.L. Zamorano, A. González Gómez, et al.
Prognostic Impact of Right Ventricular Strain in Isolated Severe Tricuspid Regurgitation.
J Am Soc Echocardiogr., (2023), 36 pp. 615-623
[15]
X. Galloo, F. Fortuni, M.C. Meucci, et al.
Association of right atrial strain and long-term outcome in severe secondary tricuspid regurgitation.
[16]
M. Tomaselli, D.N. Radu, L.P. Badano, et al.
Right Atrial Remodeling and Outcome in Patients with Secondary Tricuspid Regurgitation.
J Am Soc Echocardiogr., (2024), 37 pp. 495-505
[17]
R. Hinojar, C. Fernandez-Golfin, A. Gonzalez Gomez, et al.
STREI: a new index of right heart function in isolated severe tricuspid regurgitation by speckle-tracking echocardiography.
Eur Heart J Cardiovasc Imaging., (2024), 25 pp. 520-529
[18]
K.M. Lara-Breitinger, C.G. Scott, V.T. Nkomo, et al.
Tricuspid Regurgitation Impact on Outcomes (TRIO): A Simple Clinical Risk Score.
Mayo Clin Proc., (2022), 97 pp. 1449-1461
[19]
A. Gonzalez-Gomez, C. Fernandez-Golfin, R. Hinojar, et al.
The 4A classification for patients with tricuspid regurgitation.
Rev Esp Cardiol., (2023), 76 pp. 845-851
[20]
V.N. Rao, A. Giczewska, K. Chiswell, et al.
Long-term outcomes of phenoclusters in severe tricuspid regurgitation.
Eur Heart J., (2023), 44 pp. 1910-1923
[21]
V. Anand, C.G. Scott, M.C. Hyun, et al.
The 5 Phenotypes of Tricuspid Regurgitation: Insight From Cluster Analysis of Clinical and Echocardiographic Variables.
J Am Coll Cardiol Intv., (2023), 16 pp. 156-165
[22]
B. Deb, C. Scott, S.V. Pislaru, et al.
Machine learning facilitates the prediction of long-term mortality in patients with tricuspid regurgitation.
Open Heart., (2023), 10 pp. e002417
[23]
M. Vely, G. L’Official, E. Galli, et al.
Functional tricuspid regurgitation: A clustering analysis and prognostic validation of three echocardiographic phenotypes in an external cohort.
Int J Cardiol., (2022), 365 pp. 140-147
[24]
T.K.M. Wang, R. Reyaldeen, K. Akyuz, et al.
Echocardiography versus magnetic resonance imaging quantification and novel algorithm for isolated severe tricuspid regurgitation.
Am J Cardiol., (2024), 211 pp. 40-48
[25]
D.R. Florescu, D. Muraru, C. Florescu, et al.
Right heart chambers geometry and function in patients with the atrial and the ventricular phenotypes of functional tricuspid regurgitation.
Eur Heart J Cardiovasc Imaging., (2022), 23 pp. 930-940
[26]
D. Genovese, V. Mor-Avi, C. Palermo, et al.
Comparison Between Four-Chamber and Right Ventricular-Focused Views for the Quantitative Evaluation of Right Ventricular Size and Function.
J Am Soc Echocardiogr., (2019), 32 pp. 484-494
[27]
P. Ciampi, L.P. Badano, D.R. Florescu, et al.
Comparison of RA Volumes Obtained Using the Standard Apical 4-Chamber and the RV-Focused Views.
JACC Cardiovascular imaging., (2023), 16 pp. 248-250
[28]
D. Muraru, V. Spadotto, A. Cecchetto, et al.
New speckle-tracking algorithm for right ventricular volume analysis from three-dimensional echocardiographic data sets: validation with cardiac magnetic resonance and comparison with the previous analysis tool.
Eur Heart J Cardiovasc Imaging., (2016), 17 pp. 1279-1289
[29]
L.P. Badano, M. Tomaselli, D. Muraru, X. Galloo, C.H.P. Li, N. Ajmone Marsan.
Advances in the Assessment of Patients With Tricuspid Regurgitation: A State-of-the-Art Review on the Echocardiographic Evaluation Before and After Tricuspid Valve Interventions.
J Am Soc Echocardiogr., (2024), 37 pp. 1083-1102
[30]
L.P. Badano, D. Muraru.
Make Right Heart Remodeling in Secondary Tricuspid Regurgitation as Simple as Possible, But Not Simpler.
JACC Cardiovascular Imaging., (2024), 17 pp. 607-609
[31]
M. Gavazzoni, L.P. Badano, G.M. Pugliesi, et al.
Assessing right atrial size in patients with tricuspid regurgitation: importance of the right ventricular-focused view.
Eur Heart J Cardiovasc Imaging., (2024), 25 pp. 1743-1750
[32]
M. Tomaselli, L.P. Badano, R. Mene, et al.
Impact of correcting the 2D PISA method on the quantification of functional tricuspid regurgitation severity.
Eur Heart J Cardiovasc Imaging., (2022), 23 pp. 1459-1470
[33]
D. Muraru, M. Gavazzoni, F. Heilbron, et al.
Reference ranges of tricuspid annulus geometry in healthy adults using a dedicated three-dimensional echocardiography software package.
Front Cardiovasc Med., (2022), 9 pp. 1011931
[34]
J. Dreyfus, F. Juarez-Casso, A. Sala, et al.
Benefit of isolated surgical valve repair or replacement for functional tricuspid regurgitation and long-term outcomes stratified by the TRI-SCORE.
Eur Heart J., (2024), 45 pp. 4512-4522
[35]
R.T. Hahn, M.K. Lawlor, C.J. Davidson, et al.
TVARC Steering Committee. Tricuspid Valve Academic Research Consortium Definitions for Tricuspid Regurgitation and Trial Endpoints.
J Am Coll Cardiol., (2023), 17 pp. 1711-1735

Contributed equally to the paper.

Copyright © 2025. Sociedad Española de Cardiología