
It is unknown whether aortic valve calcium volume, as measured by contrast-enhanced computed tomography angiography (angio-CT), is associated with mortality in patients undergoing transcatheter aortic valve implantation (TAVI). We aimed to confirm that contrast-enhanced aortic valve calcium correlates with noncontrast-enhanced calcium score and provides useful prognostic information in patients undergoing TAVI.
MethodsThis retrospective observational study included patients from 2 high-volume TAVI centers in Germany, all of whom underwent high-quality angio-CT prior to TAVI. Calcium volume in contrast-enhanced angio-CT was calculated using 3Mensio software (Pie Medical, The Netherlands), while the calcium score from noncontrast-enhanced angio-CT was obtained using the Syngo.via (Siemens Healthineers, Germany) workstation to validate contrast-enhanced angio-CT values. Calcium volume was dichotomized using the median based on to sex-specific values from contrast-enhanced angio-CT, and the risk associated with increased calcium volume was determined using Cox proportional hazard regression analysis.
ResultsWe included 3318 TAVI patients. A good correlation was observed between noncontrast-enhanced and contrast-enhanced angio-CT (r2=0.680; P<.001). The median values for sex-specific contrast-enhanced angio-CT calcium volume were 514 mm3 for women and 1025 mm3 for men. Patients with higher calcium volumes showed lower mortality at 1 year (8.8% vs 12.1%; adjusted HR, 0.86; 95%CI, 0.75-0.98; P=.02) compared with those with lower calcium volumes.
ConclusionsCalcium volume in contrast-enhanced angio-CT correlated well with noncontrast-enhanced angio-CT calcium score. Patients with higher calcium volume showed lower mortality at 1 year after TAVI.
Keywords
Calcified aortic valve stenosis (AVS) is the most common valvular heart disease in the elderly.1 Echocardiography is the primary diagnostic tool for assessing AVS severity,2 while multidetector computed tomography aids in risk stratification by quantifying aortic valve calcification (AVC) and correlating it with AVS severity.3,4 Current guidelines recommend the use of noncontrast-enhanced computed tomography angiography (angio-CT) for assessing AVC load using the Agatston method, accounting for sex differences.5,6
However, contrast-enhanced angio-CT is now standard for screening7 and defining device landing zone calcium volume (DLZ-CV)8–10 in transcatheter aortic valve implantation (TAVI) patients with severe AVS, despite no established threshold for this method.11–14 Although valvular calcium load predicts mortality in untreated AVS,15 its prognostic role post-TAVI remains unclear. Therefore, standardized angio-CT AVC thresholds to predict post-TAVI mortality are still needed.
We aimed to confirm in the current study population that contrast-enhanced calcium volume correlates with noncontrast-enhanced calcium score and provides useful prognostic information in patients undergoing TAVI.
METHODSStudy population and endpointsThe current study included patients from 2 high-volume centers in Germany (German Heart Centre Munich and Kerckhoff Klinik, Bad Nauheim) undergoing TAVI after heart team evaluation between January 2014 and December 2022. All patients with native calcified AVS and available high-quality angio-CT for TAVI who received the latest-generation transcatheter heart valves (THV) via femoral access were included in the present study. Patients were treated according to local standards, and the selection of THV type was at the operator's discretion.
The study was performed in accordance with the principles of the Declaration of Helsinki and all patients provided written informed consent for the procedure. Ethics approval was obtained from the ethics committee of the Technical University Munich under the registry OBSERVTAVI (525/17) and from the ethics committee of Landesärztekammer Hessen (FF 155/2014). Angio-CT measurements were performed and recorded in a specific database before THV implantation. Baseline clinical characteristics, procedural characteristics, and laboratory values were entered into a customized database. For Valve Academic Research Consortium 3 (VARC-3)16 defined clinical outcomes, in-hospital and discharge follow-up was monitored and registered. Follow-up was performed via telephone contact, hospital visit, or follow-up letter.
Computed tomography angiography acquisitionFor the purpose of the study, all noncontrast-enhanced angio-CTs were evaluated using the Syngo.via workstation (Siemens Healthineers, Germany), and contrast-enhanced angio-CT studies were evaluated using 3Mensio software (Pie Medical, The Netherlands) to assess the level and distribution of valvular calcification load in Hounsfield units and cubic millimeters (mm3), respectively.
Angio-CT examinations were acquired using a dual-energy scanner (Somatom Force, Siemens Healthineers, Germany) with a collimation of 2 x 192 x 0.6mm and a gantry rotation time of 250ms. Nonenhanced prospective electrocardiogram-gated aortic valve calcium scans were obtained in end-diastole for calcium score analysis and axial thin slice images were reconstructed with a 3-mm slice thickness and an increment of 1.5mm. Tube voltage was selected between 70-120kV associated with 40-80 mAs, and tube current was adapted automatically based on body size (CARE Dose). Contrast circulation time was determined using a test-bolus with 10mL of contrast media (Imeron 350, Bracco Imaging GmbH, Germany), followed by a 50mL 0.9% saline chaser. Axial thin slice images were reconstructed with a 0.6mm slice width (increment of 0.4) for aortic valve angio-CT.
Calcium volume analysisNoncontrast-enhanced angio-CT calcium volumeNoncontrast-enhanced angio-CT was evaluated using the Syngo.via workstation. The DLZ-CV was measured according to the Agatston method.6 In brief, a threshold of 130 Hounsfield units was set for a calcific lesion with an area more than 1 mm2. Only pixels with a density >130 units were displayed after the elimination of noncalcified pixels. The DLZ-CV was set as a “region of interest”, and automated measurements in mm3 and the maximal angio-CT number in Hounsfield units were recorded. The region of interest included the aortic valve and adjacent calcium deposits within the left ventricular outflow tract. Regions incorrectly selected as valvular calcium were cropped manually. Values were automatically obtained from the software as volume in mm3 and Hounsfield units.
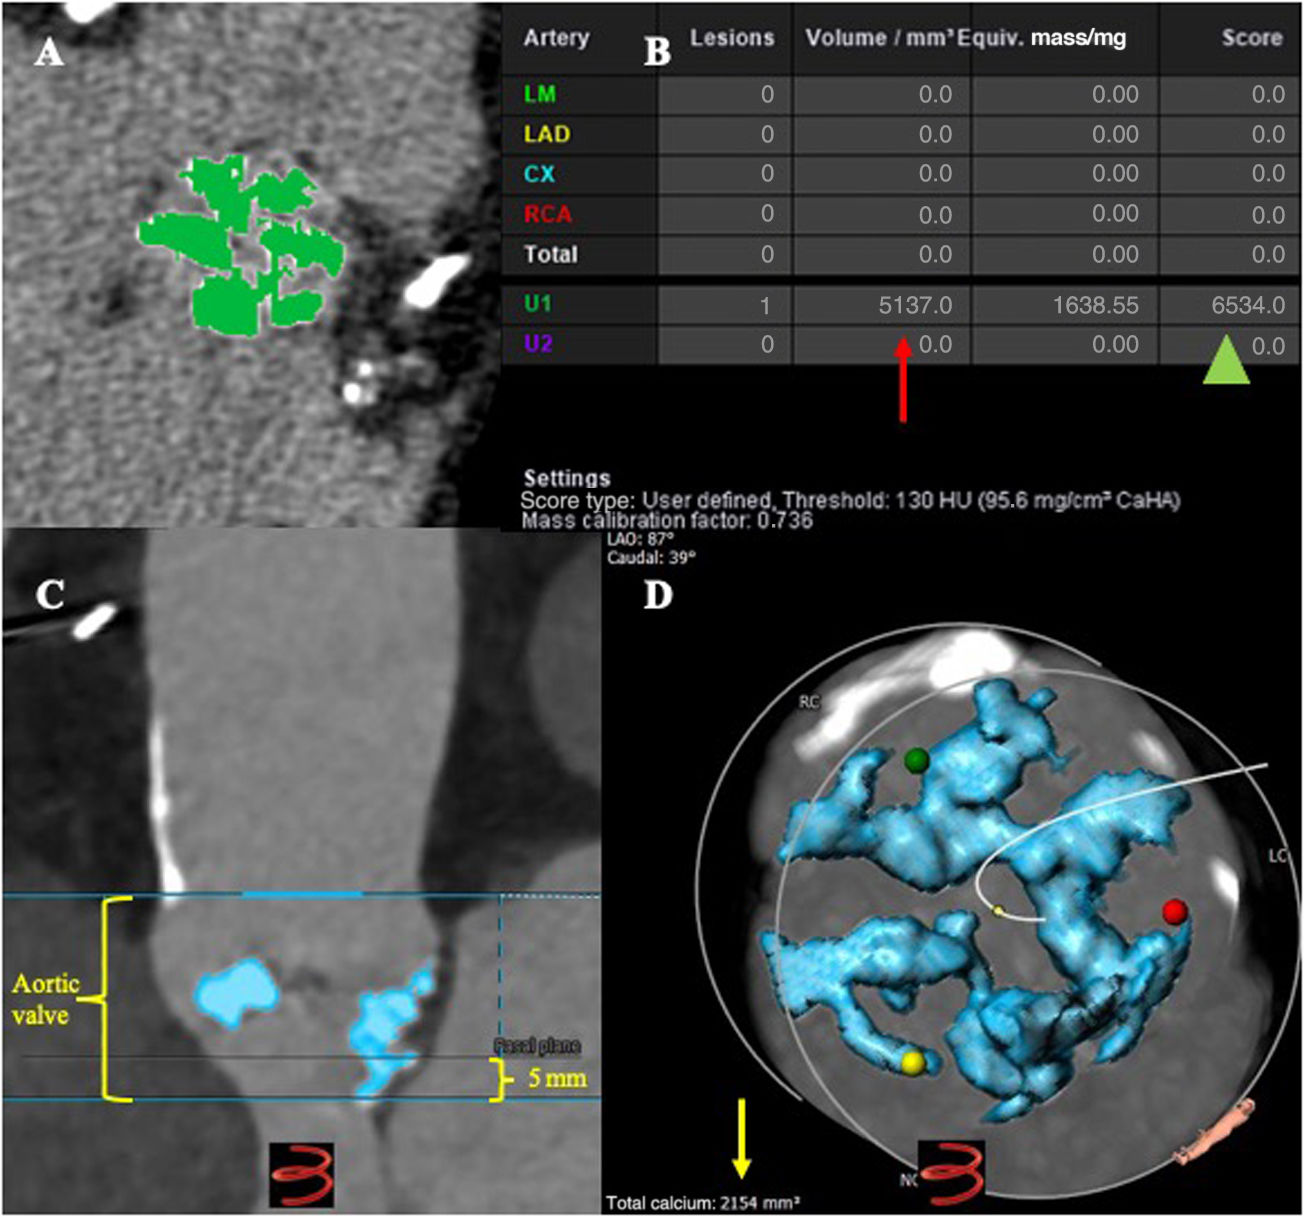
Contrast-enhanced angio-CT calcium volumeContrast-enhanced angio-CTs were analyzed using 3Mensio software. The DLZ-CV was measured semi-automatically within a prespecified region of interest (above the level of the commissures including the leaflets and the left ventricular outflow tract 5mm below the annular plane) using a scan-specific individual threshold derived from the mean attenuation of the ascending aorta plus 4 standard deviations and an additional volume filter with a threshold of 5mm312(figure 1). Calcium volume measurements were determined for the aortic valve (basal plane to above the commissures), aortic annulus (3mm above basal plane and 2mm below basal plane) and the left ventricular outflow tract (from basal plane to 5mm below). Calcification was also measured separately for each cusp. Values were obtained in mm3.
 methodology to measure calcium volume. A: noncontrast-enhanced angio-CT in Syngo.via station showing the aortic valve calcification at the device landing zone (DLZ) using the Agatston method (green color); B: calcium volume in mm3 (red arrow), calcium score (green head arrow) in Hounsfield units; C: contrast-enhanced angio-CT using 3Mensio software, including the area of interest, basal plane from the hinge points, aortic valve from above the level of commissures and 5mm below the basal plane; D: total calcium volume in mm3 (yellow arrow) at the DLZ using scan-specific individual thresholds derived from the mean attenuation of the ascending aorta plus 4 standard deviations and an additional volume filter with a threshold of 5 mm3.")
Computed tomography angiography (angio-CT) methodology to measure calcium volume. A: noncontrast-enhanced angio-CT in Syngo.via station showing the aortic valve calcification at the device landing zone (DLZ) using the Agatston method (green color); B: calcium volume in mm3 (red arrow), calcium score (green head arrow) in Hounsfield units; C: contrast-enhanced angio-CT using 3Mensio software, including the area of interest, basal plane from the hinge points, aortic valve from above the level of commissures and 5mm below the basal plane; D: total calcium volume in mm3 (yellow arrow) at the DLZ using scan-specific individual thresholds derived from the mean attenuation of the ascending aorta plus 4 standard deviations and an additional volume filter with a threshold of 5 mm3.
The primary endpoint was all-cause mortality at 1 year. VARC-3 definitions were applied to describe procedural and follow-up outcomes.
Statistical analysisCategorical variables were summarized using frequencies and proportions and compared using the chi-square test. Continuous data were tested for normality with the Shapiro-Wilk test and summarized using mean+standard deviation or median [interquartile range (IQR)] depending on data distribution. Correlation analysis of continuous data were applied to compare Hounsfield units and calcium volume from noncontrast-enhanced angio-CT against calcium volume from contrast-enhanced angio-CT. To derive methodological agreement, Bland-Altman analysis was used and validated by the intraclass correlation coefficient (with absolute agreement). Calcium volume was subsequently dichotomized using the median and sex-specific cutoffs established. The Kaplan-Meier method was used to plot the mortality curves and Cox proportional hazard regression analysis was used to calculate the risk associated with increased calcium volume (hazard ratio [HR] 95% confidence interval [95%CI]). Selection of covariates for adjusted Cox proportional hazard regression analysis was performed using the least absolute shrinkage and selection operator regression method after entering all baseline characteristics as potential confounders.
The P value for the interaction effect between covariates and (log)time was derived. In addition, excess hazard models with multidimensional penalized splines were fitted to allow for time-dependent effects. HRs were plotted for patients above the sex-specific calcium volume cutoff relative to the reference HR for patients below the specific cutoff, and P values were generated for each time-period-specific hazard ratio.17,18
To account for disparities in baseline and procedural factors among dichotomized patient strata (high and low calcium volume) and to control for potential confounding factors, we conducted a multivariable regression model based on generalized estimation equations and adjusted for a weighted estimation using a propensity score to be assigned to patients with high or low calcium volume (inverse probability of treatment weighting [IPTW]-analysis). Multiple imputation by chained equations was used for missing data. All tests were 2-sided at the .05 significance level.
The statistical analysis was performed using IBM SPSS Statistics (version 29, IBM Corporation, United States), JMP Pro (version 16.0, Cary, United States), and R Studio (Posit PBC, United States) with R software version 4.1 (R Foundation, Austria).
RESULTSA total of n=5699 patients who underwent TAVI in 2 high-volume centers between January 2014 and December 2022 were screened for inclusion. After the exclusion of n=2381 patients (low quality angio-CT data, n=1981; first-generation/out-of-market THV systems implanted, n=357; surgical implantations, n=6; and aortic insufficiency as the main indication, n=37), a total of 3318 patients had contrast-enhanced angio-CT and were included in the analysis (figure 2).
Calcium score in noncontrast-enhanced angio-CT and calcium volume in contrast-enhanced angio-CT
In 1309 of the 3318 patients included, noncontrast-enhanced angio-CT was also available. One-year Kaplan-Meier analysis performed in patients with noncontrast-enhanced angio-CT and AVC stratified by Hounsfield units (n=1300) showed lower mortality in patients above the sex-specific median of Hounsfield units compared to those below the sex-specific median (11.1% vs 13.9%) (). Adjusted Cox proportional hazard regression analysis up to 1 year revealed a 14% lower mortality (HR, 0.86; 95%CI, 0.76-0.98; P=.02) () for patients above the sex-specific median of Hounsfield units. Landmark analysis showed no Hounsfield units related difference in mortality up to 30 days [adjusted HR, 1.01; 95%CI, 0.90-1.02; P=.36] ().
Noncontrast-enhanced angio-CT calcium volume showed good correlation to contrast-enhanced angio-CT calcium volume (r=0.823, r2=0.678; P<.001); even better correlation was observed between Hounsfield units and contrast-enhanced calcium volume (r=0.825, r2=0.680; P<.001) ( and ). Bland-Altman plots showed good agreement between methods (), with an intraclass correlation coefficient for agreement of 0.794 for noncontrast-enhanced and contrast-enhanced angio-CT calcium volume, and 0.865 for contrast-enhanced angio-CT calcium volume and Hounsfield units ().
Calcium volume in contrast-enhanced angio-CT and prognosisBaseline clinical, echocardiographic and angio-CT characteristics are described in table 1. Obtained median calcium volume values for contrast-enhanced angio-CT calcium volume were 514 mm3 in women and 1025 mm3 in men (). Median age was 81 [78; 85] years, and 46.8% were female. The median Society of Thoracic Surgeons (STS) Predicted Risk of Mortality in the entire population was 3.54 [3.42; 5.41] and median EuroSCORE II was 3.57 [2.23; 6.29]. Patients with aortic valve high calcium volume (HCV) had a smaller valve area (all=0.70 [0.58; 0.83] cm2; low calcium volume [LCV]=0.71 [0.60; 0.86] cm2; HCV=0.66 [0.52; 0.80] cm2; P<.001) and a higher transvalvular mean gradient (all=43 [35; 52] mmHg; LCV=39 [29; 45] mmHg; HCV=48 [41; 59] mmHg; P<.001).
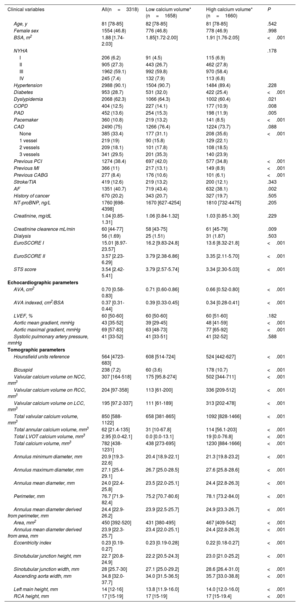
Baseline characteristics
| Clinical variables | All(n=3318) | Low calcium volume*(n=1658) | High calcium volume*(n=1660) | P |
|---|---|---|---|---|
| Age, y | 81 [78-85] | 82 [78-85] | 81 [78-85] | .542 |
| Female sex | 1554 (46.8) | 776 (46.8) | 778 (46.9) | .998 |
| BSA, m2 | 1.88 [1.74-2.03] | 1.85[1.72-2.00] | 1.91 [1.76-2.05] | <.001 |
| NYHA | .178 | |||
| I | 206 (6.2) | 91 (4.5) | 115 (6.9) | |
| II | 905 (27.3) | 443 (26.7) | 462 (27.8) | |
| III | 1962 (59.1) | 992 (59.8) | 970 (58.4) | |
| IV | 245 (7.4) | 132 (7.9) | 113 (6.8) | |
| Hypertension | 2988 (90.1) | 1504 (90.7) | 1484 (89.4) | .228 |
| Diabetes | 953 (28.7) | 531 (32.0) | 422 (25.4) | <.001 |
| Dyslypidemia | 2068 (62.3) | 1066 (64.3) | 1002 (60.4) | .021 |
| COPD | 404 (12.5) | 227 (14.1) | 177 (10.9) | .008 |
| PAD | 452 (13.6) | 254 (15.3) | 198 (11.9) | .005 |
| Pacemaker | 360 (10.8) | 219 (13.2) | 141 (8.5) | <.001 |
| CAD | 2490 (75) | 1266 (76.4) | 1224 (73.7) | .088 |
| None | 385 (33.4) | 177 (31.1) | 208 (35.6) | <.001 |
| 1 vessel | 219 (19) | 90 (15.8) | 129 (22.1) | |
| 2 vessels | 209 (18.1) | 101 (17.8) | 108 (18.5) | |
| 3 vessels | 341 (29.5) | 201 (35.3) | 140 (23.9) | |
| Previous PCI | 1274 (38.4) | 697 (42.0) | 577 (34.8) | <.001 |
| Previous MI | 366 (11) | 217 (13.1) | 149 (8.9) | <.001 |
| Previous CABG | 277 (8.4) | 176 (10.6) | 101 (6.1) | <.001 |
| Stroke/TIA | 419 (12.6) | 219 (13.2) | 200 (12.1) | .343 |
| AF | 1351 (40.7) | 719 (43.4) | 632 (38.1) | .002 |
| History of cancer | 670 (20.2) | 343 (20.7) | 327 (19.7) | .505 |
| NT-proBNP, ng/L | 1760 [698-4398] | 1670 [627-4254] | 1810 [732-4475] | .205 |
| Creatinine, mg/dL | 1.04 [0.85-1.31] | 1.06 [0.84-1.32] | 1.03 [0.85-1.30] | .229 |
| Creatinine clearence mL/min | 60 [44-77] | 58 [43-75] | 61 [45-79] | .009 |
| Dialysis | 56 (1.69) | 25 (1.51) | 31 (1.87) | .503 |
| EuroSCORE I | 15.01 [8.97-23.57] | 16.2 [9.83-24.8] | 13.6 [8.32-21.8] | <.001 |
| EuroSCORE II | 3.57 [2.23-6.29] | 3.79 [2.38-6.86] | 3.35 [2.11-5.70] | <.001 |
| STS score | 3.54 [2.42-5.41] | 3.79 [2.57-5.74] | 3.34 [2.30-5.03] | <.001 |
| Echocardiographic parameters | ||||
| AVA, cm2 | 0.70 [0.58-0.83] | 0.71 [0.60-0.86] | 0.66 [0.52-0.80] | <.001 |
| AVA indexed, cm2/BSA | 0.37 [0.31-0.44] | 0.39 [0.33-0.45] | 0.34 [0.28-0.41] | <.001 |
| LVEF, % | 60 [50-60] | 60 [50-60] | 60 [51-60] | .182 |
| Aortic mean gradient, mmHg | 43 [35-52] | 39 [29-45] | 48 [41-59] | <.001 |
| Aortic maximal gradient, mmHg | 69 [57-83] | 63 [48-73] | 77 [65-92] | <.001 |
| Systolic pulmonary artery pressure, mmHg | 41 [33-52] | 41 [33-51] | 41 [32-52] | .588 |
| Tomographic parameters | ||||
| Hounsfield units reference | 564 [4723-683] | 608 [514-724] | 524 [442-627] | <.001 |
| Bicuspid | 238 (7.2) | 60 (3.6) | 178 (10.7) | <.001 |
| Valvular calcium volume on NCC, mm3 | 307 [164-518] | 175 [95.8-274] | 502 [344-711] | <.001 |
| Valvular calcium volume on RCC, mm3 | 204 [97-358] | 113 [61-200] | 336 [209-512] | <.001 |
| Valvular calcium volume on LCC, mm3 | 195 [97.2-337] | 111 [61-189] | 313 [202-478] | <.001 |
| Total valvular calcium volume, mm3 | 850 [588-1122] | 658 [381-865] | 1092 [828-1466] | <.001 |
| Total annular calcium volume, mm3 | 62 [21.4-135] | 31 [10-67.8] | 114 [56.1-203] | <.001 |
| Total LVOT calcium volume, mm3 | 2.95 [0.0-42.1] | 0.0 [0.0-13.1] | 19 [0.0-76.8] | <.001 |
| Total calcium volume, mm3 | 782 [438-1231] | 438 [273-695] | 1230 [884-1666] | <.001 |
| Annulus minimum diameter, mm | 20.9 [19.3-22.6] | 20.4 [18.9-22.1] | 21.3 [19.8-23.2] | <.001 |
| Annulus maximum diameter, mm | 27.1 [25.4-29.1] | 26.7 [25.0-28.5] | 27.6 [25.8-28.6] | <.001 |
| Annulus mean diameter, mm | 24.0 [22.4-25.8] | 23.5 [22.0-25.1] | 24.4 [22.8-26.3] | <.001 |
| Perimeter, mm | 76.7 [71.9-82.4] | 75.2 [70.7-80.6] | 78.1 [73.2-84.0] | <.001 |
| Annulus mean diameter derived from perimeter, mm | 24.4 [22.9-26.2] | 23.9 [22.5-25.7] | 24.9 [23.3-26.7] | <.001 |
| Area, mm2 | 450 [392-520] | 431 [380-495] | 467 [409-542] | <.001 |
| Annulus mean diameter derived from area, mm | 23.9 [22.3-25.7] | 23.4 [22.0-25.1] | 24.4 [22.8-26.3] | <.001 |
| Eccentricity index | 0.23 [0.19-0.27] | 0.23 [0.19-0.28] | 0.22 [0.18-0.27] | <.001 |
| Sinotubular junction height, mm | 22.7 [20.8-24.9] | 22.2 [20.5-24.3] | 23.0 [21.0-25.2] | <.001 |
| Sinotubular junction width, mm | 28 [25.7-30] | 27.1 [25.0-29.2] | 28.6 [26.4-31.0] | <.001 |
| Ascending aorta width, mm | 34.8 [32.0-37.7] | 34.0 [31.5-36.5] | 35.7 [33.0-38.8] | <.001 |
| Left main height, mm | 14 [12-16] | 13.8 [11.9-16.0] | 14.0 [12.0-16.0] | <.001 |
| RCA height, mm | 17 [15-19] | 17 [15-19] | 17 [15-19.4] | <.001 |
AF, atrial fibrillation; AVA, aortic valve area; BSA, body surface area; CABG, coronary artery bypass graft; CAD, coronary artery disease; cm2, square centimeters; COPD, chronic obstructive pulmonary disease; LCC, left coronary cusp; LVEF, left ventricle ejection fraction; MI, myocardial infarction; NCC, noncoronary cusp; NT-proBNP, N terminal pro brain natriuretic peptide; NYHA, New York Heart Association; PAD, peripheral arterial disease; PCI, percutaneous coronary intervention; RCA, right coronary artery; RCC, right coronary cusp; STS, surgical thoracic society; TIA, transient ischemic attack.
The data are expressed as No. (%) or median [interquartile range].
Calcium volume sex-specified: Low (women <514 mm3, men <1025 mm3); High (women >514 mm3, men >1025 mm3)
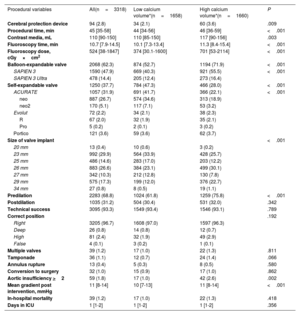
Procedural characteristics and complications according to VARC-3 definitions are described in table 2. The Sapien family THV (Edwards Lifesciences, United States) was the most frequently used device (all=62.3%; LCV=52.7%; HCV=71.9%; P<.001) followed by the Acurate family (Boston Scientific, United States) (all=31.9%; LCV=41.7%; HCV=22.1%; P<.001). Overall, the 23mm THV was the most frequently implanted THV size (all=29.9%), followed by 26mm (all=26.6%) and 29mm THVs (all=17.3%). Technical success was similar within groups (all=93.3%; LCV=93.4%; HCV=93.1%; P=.78). Predilation was more common in HCV (75.8%), compared to LCV (61.8%, P<.001). Slightly higher mean gradients were observed in HCV (all 11 [8; 14] mmHg; LCV=10 [7; 13] mmHg; HCV=11 [8; 14] mmHg; P<.001); aortic insufficiency greater than moderate was observed more often in HCV compared to LCV (2.6% vs 1.0%, respectively, P<.001).
Procedural characteristics
| Procedural variables | All(n=3318) | Low calcium volume*(n=1658) | High calcium volume*(n=1660) | P |
|---|---|---|---|---|
| Cerebral protection device | 94 (2.8) | 34 (2.1) | 60 (3.6) | .009 |
| Procedural time, min | 45 [35-58] | 44 [34-56] | 46 [36-59] | <.001 |
| Contrast media, mL | 110 [90-150] | 110 [85-150] | 117 [90-156] | .003 |
| Fluoroscopy time, min | 10.7 [7.9-14.5] | 10.1 [7.3-13.4] | 11.3 [8.4-15.4] | <.001 |
| Fluoroscopy dose, cGy×cm2 | 524 [38-1847] | 374 [30.1-1600] | 701 [53-2114] | <.001 |
| Balloon-expandable valve | 2068 (62.3) | 874 (52.7) | 1194 (71.9) | <.001 |
| SAPIEN 3 | 1590 (47.9) | 669 (40.3) | 921 (55.5) | <.001 |
| SAPIEN 3 Ultra | 478 (14.4) | 205 (12.4) | 273 (16.4) | |
| Self-expandable valve | 1250 (37.7) | 784 (47.3) | 466 (28.0) | <.001 |
| ACURATE | 1057 (31.9) | 691 (41.7) | 366 (22.1) | <.001 |
| neo | 887 (26.7) | 574 (34.6) | 313 (18.9) | |
| neo2 | 170 (5.1) | 117 (7.1) | 53 (3.2) | |
| Evolut | 72 (2.2) | 34 (2.1) | 38 (2.3) | |
| R | 67 (2.0) | 32 (1.9) | 35 (2.1) | |
| Pro | 5 (0.2) | 2 (0.1) | 3 (0.2) | |
| Portico | 121 (3.6) | 59 (3.6) | 62 (3.7) | |
| Size of valve implant | <.001 | |||
| 20 mm | 13 (0.4) | 10 (0.6) | 3 (0.2) | |
| 23 mm | 992 (29.9) | 564 (33.9) | 428 (25.7) | |
| 25 mm | 486 (14.6) | 283 (17.0) | 203 (12.2) | |
| 26 mm | 883 (26.6) | 384 (23.1) | 499 (30.1) | |
| 27 mm | 342 (10.3) | 212 (12.8) | 130 (7.8) | |
| 29 mm | 575 (17.3) | 199 (12.0) | 376 (22.7) | |
| 34 mm | 27 (0.8) | 8 (0.5) | 19 (1.1) | |
| Predilation | 2283 (68.8) | 1024 (61.8) | 1259 (75.8) | <.001 |
| Postdilation | 1035 (31.2) | 504 (30.4) | 531 (32.0) | .342 |
| Technical success | 3095 (93.3) | 1549 (93.4) | 1546 (93.1) | .789 |
| Correct position | .192 | |||
| Right | 3205 (96.7) | 1608 (97.0) | 1597 (96.3) | |
| Deep | 26 (0.8) | 14 (0.8) | 12 (0.7) | |
| High | 81 (2.4) | 32 (1.9) | 49 (2.9) | |
| False | 4 (0.1) | 3 (0.2) | 1 (0.1) | |
| Multiple valves | 39 (1.2) | 17 (1.0) | 22 (1.3) | .811 |
| Tamponade | 36 (1.1) | 12 (0.7) | 24 (1.4) | .066 |
| Annulus rupture | 13 (0.4) | 5 (0.3) | 8 (0.5) | .580 |
| Conversion to surgery | 32 (1.0) | 15 (0.9) | 17 (1.0) | .862 |
| Aortic insufficiency >2 | 59 (1.8) | 17 (1.0) | 42 (2.6) | .002 |
| Mean gradient post intervention, mmHg | 11 [8-14] | 10 [7-13] | 11 [8-14] | <.001 |
| In-hospital mortality | 39 (1.2) | 17 (1.0) | 22 (1.3) | .418 |
| Days in ICU | 1 [1-2] | 1 [1-2] | 1 [1-2] | .356 |
ICU, intensive care unit.
The data are expressed as No. (%) or median [interquartile range].
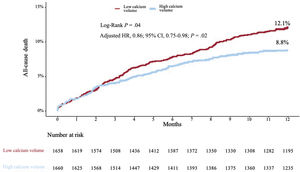
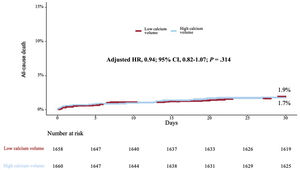
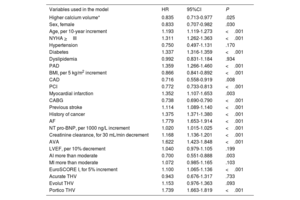
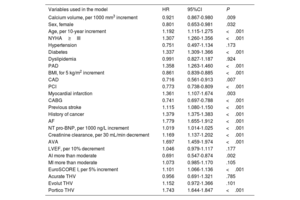
Kaplan-Meier analysis up to 1 year demonstrated lower mortality in patients above the sex-specific median of calcium volume compared to those below the sex-specific median (8.8% vs 12.1%, respectively, P=.04) (figure 3). Adjusted (from baseline, tomographic, echocardiographic characteristics and valve type [table 1 and table 2]) Cox proportional hazard regression analysis up to 1 year revealed a 16% lower mortality [HR, 0.84; 95%CI, 0.71-0.98); P=.02] (table 3) for patients above the sex-specific median of calcium volume. Landmark analysis showed no calcium volume related difference in mortality up to 30 days (adjusted HR, 1.09; 95%CI, 0.94-1.26; P=.23) (figure 4); after this time to 1-year, patients with HCV showed a significantly lower mortality adjusted (HR, 0.81; 95%CI, 0.73-0.90); P<.001) (figure 5). When calcium volume was included as a continuous parameter in the Cox proportional hazard analysis, its significant association with lower 1-year mortality was confirmed (HR, 0.92; 95%CI, 0.87-0.98, P=.009 per 1000 mm3) (table 4).
 and high calcium volume (blue line). 95%CI, 95% confidence interval; HR, hazard ratio.")
Adjusted Cox proportional hazard regression analysis for 1-year mortality, 2 categories of calcium volume
| Variables used in the model | HR | 95%CI | P |
|---|---|---|---|
| Higher calcium volume* | 0.835 | 0.713-0.977 | .025 |
| Sex, female | 0.833 | 0.707-0.982 | .030 |
| Age, per 10-year increment | 1.193 | 1.119-1.273 | <.001 |
| NYHA >III | 1.311 | 1.262-1.363 | <.001 |
| Hypertension | 0.750 | 0.497-1.131 | .170 |
| Diabetes | 1.337 | 1.316-1.359 | <.001 |
| Dyslipidemia | 0.992 | 0.831-1.184 | .934 |
| PAD | 1.359 | 1.266-1.460 | <.001 |
| BMI, per 5 kg/m2 increment | 0.866 | 0.841-0.892 | <.001 |
| CAD | 0.716 | 0.558-0.919 | .008 |
| PCI | 0.772 | 0.733-0.813 | <.001 |
| Myocardial infarction | 1.352 | 1.107-1.653 | .003 |
| CABG | 0.738 | 0.690-0.790 | <.001 |
| Previous stroke | 1.114 | 1.089-1.140 | <.001 |
| History of cancer | 1.375 | 1.371-1.380 | <.001 |
| AF | 1.779 | 1.653-1.914 | <.001 |
| NT pro-BNP, per 1000 ng/L increment | 1.020 | 1.015-1.025 | <.001 |
| Creatinine clearance, for 30 mL/min decrement | 1.168 | 1.136-1.201 | <.001 |
| AVA | 1.622 | 1.423-1.848 | <.001 |
| LVEF, per 10% decrement | 1.040 | 0.979-1.105 | .199 |
| AI more than moderate | 0.700 | 0.551-0.888 | .003 |
| MI more than moderate | 1.072 | 0.985-1.165 | .103 |
| EuroSCORE I, for 5% increment | 1.100 | 1.065-1.136 | <.001 |
| Acurate THV | 0.943 | 0.676-1.317 | .733 |
| Evolut THV | 1.153 | 0.976-1.363 | .093 |
| Portico THV | 1.739 | 1.663-1.819 | <.001 |
95%CI, 95% confidence interval; AI, aortic insufficiency; AF, atrial fibrillation; AVA, aortic valve area; BMI, body mass index; CABG, coronary artery bypass graft; CAD, coronary artery disease; HR, hazard ratio; LVEF, left ventricle ejection fraction; MI, mitral insufficiency; NT-proBNP, N terminal brain natriuretic peptide; PAD, peripheral artery disease; PCI, percutaneous coronary intervention; THV, transcatheter heart valve.
 and high calcium volume (blue line) and mortality at 30 days. 95%CI, 95% confidence interval; HR, hazard ratio.")

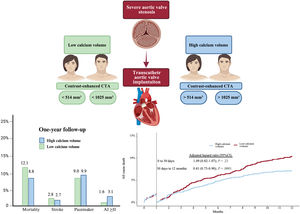
Central illustration. Sex-specific calcium volume threshold as a predictor for mortality. High calcium volume sex-specific showed lower mortality up to one-year of follow-up in patients undergoing transcatheter aortic valve replacement, with no difference regarding stroke, pacemaker, and paravalvular/valvular insufficiency more than moderate. 95%CI, 95% confidence interval; AI, aortic insufficiency.
Adjusted Cox proportional hazard regression analysis for 1-year mortality, calcium as continuous variable
| Variables used in the model | HR | 95%CI | P |
|---|---|---|---|
| Calcium volume, per 1000 mm3 increment | 0.921 | 0.867-0.980 | .009 |
| Sex, female | 0.801 | 0.653-0.981 | .032 |
| Age, per 10-year increment | 1.192 | 1.115-1.275 | <.001 |
| NYHA≥III | 1.307 | 1.260-1.356 | <.001 |
| Hypertension | 0.751 | 0.497-1.134 | .173 |
| Diabetes | 1.337 | 1.309-1.366 | <.001 |
| Dyslipidemia | 0.991 | 0.827-1.187 | .924 |
| PAD | 1.358 | 1.263-1.460 | <.001 |
| BMI, for 5 kg/m2 increment | 0.861 | 0.839-0.885 | <.001 |
| CAD | 0.716 | 0.561-0.913 | .007 |
| PCI | 0.773 | 0.738-0.809 | <.001 |
| Myocardial infarction | 1.361 | 1.107-1.674 | .003 |
| CABG | 0.741 | 0.697-0.788 | <.001 |
| Previous stroke | 1.115 | 1.080-1.150 | <.001 |
| History of cancer | 1.379 | 1.375-1.383 | <.001 |
| AF | 1.779 | 1.655-1.912 | <.001 |
| NT pro-BNP, per 1000 ng/L increment | 1.019 | 1.014-1.025 | <.001 |
| Creatinine clearance, per 30 mL/min decrement | 1.169 | 1.137-1.202 | <.001 |
| AVA | 1.697 | 1.459-1.974 | <.001 |
| LVEF, per 10% decrement | 1.046 | 0.979-1.117 | .177 |
| AI more than moderate | 0.691 | 0.547-0.874 | .002 |
| MI more than moderate | 1.073 | 0.985-1.170 | .105 |
| EuroSCORE I, per 5% increment | 1.101 | 1.066-1.136 | <.001 |
| Acurate THV | 0.956 | 0.691-1.321 | .785 |
| Evolut THV | 1.152 | 0.972-1.366 | .101 |
| Portico THV | 1.743 | 1.644-1.847 | <.001 |
95%CI, 95% confidence interval; AI, aortic insufficiency; AF, atrial fibrillation; AVA, aortic valve area; BMI, body mass index; CABG, coronary artery bypass graft; CAD, coronary artery disease; HR, hazard ratio; LVEF, left ventricle ejection fraction; MI, mitral insufficiency; NT-proBNP, N terminal brain natriuretic peptide; PAD, peripheral artery disease; PCI, percutaneous coronary intervention; THV, transcatheter heart valve.
Excess hazard models revealed a time-dependent decrease in HR, with the strongest associations between sex-specific calcium volume cutoff and mortality observed beyond 6 months of follow-up ().
A sensitivity analysis for the sex-specific median of calcium volume and for calcium volume as a continuous parameter was also performed. After excluding EuroSCORE I as an adjustment variable from the multivariable Cox regression model, the association between calcium volume and mortality remained significant (sex-specific median of calcium volume HR, 0.82; 95%CI, 0.71-0.95; P=.006; calcium volume as a continuous parameter HR, 0.90; 95%CI, 0.85-0.96; P<.001); when individual components of EuroSCORE I were excluded from the Cox regression model, the association between calcium volume and mortality also remained significant (sex-specific median of calcium volume HR, 0.79; 95%CI, 0.65-0.96; P=.018); calcium volume as a continuous parameter HR, 0.93; 95%CI, 0.91-0.96; P<.001). Further confirmation of these findings arose from the IPTW-analysis which showed that patients in the HCV stratum had an IPTW-adjusted probability of lower 1-year mortality (odds ratio, 0.77; 95%CI, 0.61-0.99; P=.045). No significant association was observed between HCV and stroke, more than moderate aortic insufficiency or pacemaker implantation ().
DISCUSSIONThis multicenter observational study investigated the association between contrast-enhanced angio-CT -based valvular calcium volume and mortality in TAVI patients. Additionally, it assessed the accuracy of contrast-enhanced angio-CT in measuring valvular calcification compared to the gold-standard Agatston method. The main findings can be summarized as follows: a) a higher Agatston method-based valvular calcium score was shown to be associated with lower mortality up to 12 months of follow-up; b) contrast-enhanced angio-CT showed good correlation with noncontrast-enhanced angio-CT for valvular calcium volume measurements; c) HCV based on contrast-enhanced angio-CT was also associated with lower mortality up to 12 months of follow-up.
Mortality and aortic calcium volumeContrary to our expectations, our observations showed that higher valvular calcium volume and Hounsfield units were associated with lower mortality at 1 year after TAVI. This could suggest that higher valvular calcification reflects an overall high calcification burden, a biological process that confers long-term stability. Calcification was first studied as a predictor of coronary events19 and as a risk stratification variable in coronary artery disease.20 It was also reported that coronary calcification may indicate stability rather than vulnerability for myocardial infarction based on plaque composition analysis.21 Assessing the correlation between valvular and coronary calcification was beyond the scope of our study due to limitations in evaluating coronary calcium with contrast-enhanced angio-CT. However, in a sensitivity analysis including only patients with known coronary artery status by angiography, the number of affected coronary vessels was not associated with valvular calcification, nor was it an independent predictor of mortality after 12 months. Notably, higher valvular calcification only predicted lower mortality beyond 30 days, suggesting that its protective effect might not apply during the immediate postprocedural phase of TAVI. On the other hand, similar mortality rates in patients above and below the sex-specific median of calcium volume suggest that periprocedural complications secondary to increased calcium volume did not significantly impact patient outcomes. Another important confounding factor in the current analysis may have been a relevant difference in secondary prevention measures such as the intake of statin drugs and others to treat comorbidities. It has been well described that statin drugs cause dose-dependent increases in vascular calcification as assessed by serial angio-CT imaging.22,23 Whether statin drugs also cause increased valvular calcification has not been proven and remains to be determined.
Natural progression studies using noncontrast angio-CT reported higher mortality with higher valvular calcification.24,25 Similar to the validation of the coronary calcium score using the Agatston method, valvular calcification may be a marker of progressive disease including valvular, vascular, and nonvascular comorbidities in patients prospectively observed and receiving medical treatment only. However, the literature on TAVI patients presents conflicting results. Some studies report increased mortality with higher HCV,26 while others could not confirm a positive association.27,28 In a single-center cohort of 68 patients with aortic stenosis treated by self-expandable THVs,26 it was reported that patients with more than 750 mass score had higher mortality, with a HR of 24.73 (2.0- 307.8; P=.01). In addition, Pollari et al.13 observed that higher valvular calcification by contrast-enhanced angio-CT was associated with increased mortality in a sample of 581 patients undergoing TAVI; major limitations of both studies include the single-center design, its relatively small sample size, methodological evaluation of valvular calcification, and the highest tercile in the latter included patients with a calcium volume of 500 mm3; when compared to our population, this value is in the range of patients with overall low calcium volume. On the other hand, 2 additional studies reported no association between valvular calcification severity and mortality27,28; however, major limitations of these studies are the lack of granularity with regards to methodological descriptions used for the evaluation of calcium and their relatively small sample size.
Correlation of the Agatston method and contrast-enhanced angio-CT -based assessment of valvular calcificationThe Agatston method, originally validated for coronary arteries,6 was adapted for AVC evaluation3,4,7,29 and is included in current guidelines for AVS patients.5 With TAVI preprocedural planning relying on contrast-enhanced angio-CT, modifications to the Agatston method have been introduced, enabling semi-automated software assessment of valvular calcification.30–33 Using the 3Mensio software, calcium volume can be determined semi-automatically after aortic valve identification applying proprietary embedded algorithms.33 Previous studies tried to identify the most accurate threshold that correlates best with the Agatston method.11–14 Similar to these studies,12,33,34 we also found an excellent correlation between contrast-enhanced angio-CT and noncontrast-enhanced angio-CT.
Calcium volume and procedural complicationsPatients with HCV showed similar rates of procedural complications in our analysis. Although tamponade was slightly higher in HCV patients (1.4% vs 0.7%, P=.06), no significant differences were observed in annulus rupture or conversion to surgery. Consequently, it is unlikely that differences in periprocedural complications impacted the time-dependent mortality hazard immediately post-TAVI. HCV was associated with increased echocardiographic transvalvular gradients, suggesting incomplete or uneven THV expansion due to severe calcification. The preference for balloon-expandable valves in HCV patients likely reflects anatomical considerations.
Calcium volume and paravalvular/valvular regurgitationParavalvular regurgitation after TAVI has been associated with valvular calcification.9,10 A calcium mass score threshold of 858 was associated with more than moderate paravalvular regurgitation in self-expanding CoreValve THVs,26 while a calcium volume of 97 mm3 was a predictor in Acurate neo THV.35 In our study, patients with HCV had greater paravalvular regurgitation at 1 year of follow-up, confirming previous associations. Although higher calcium volume was related to increased paravalvular/valvular regurgitation, it was not associated with increased mortality.
Study limitationsThe present study is limited by the observational nature of the investigation, selection bias of patients assigned to procedures and the limited quality of angio-CT. It is also limited by the 1 year of follow-up and the specific THV implanted in this population. The role of statins was not taken into consideration due to the lack of complete information in the patients studied. Furthermore, the lack of CoreLab assessment with regard to angio-CT and echocardiographic data analysis may reduce the reliability of the reported outcomes.
CONCLUSIONSHigher contrast-enhanced angio-CT -based valvular calcification volume was associated with lower 1-year mortality in patients undergoing TAVI in 2 high-volume centers in Germany. Contrast-enhanced angio-CT -based assessment of valvular calcification showed very good correlation with the gold-standard noncontrast-enhanced angio-CT -based Agatston method.
A higher aortic valve calcification score is known to be associated with impaired survival in patients with aortic valve stenosis; the relationship between valvular calcification and mortality remains ambiguous in patients after transcatheter aortic valve replacement.
WHAT DOES THIS STUDY ADD?Higher calcium volume in patients with aortic valve stenosis undergoing transcatheter aortic valve replacement is associated with improved survival.
No funding was obtained for the purpose of this study.
ETHICAL CONSIDERATIONSThe study was performed in accordance with the principles of the Declaration of Helsinki and all patients provided written informed consent for the procedure. Ethics approval was obtained from the ethics committee from the Technical University Munich under the registry OBSERVTAVI (525/17) and from the ethics committee of the Landesärztekammer Hessen (FF 155/2014).
The SAGER guidelines regarding possible sex/gender bias have been followed in this study.
STATEMENT ON THE USE OF ARTIFICIAL INTELLIGENCENo artificial intelligence was used in the preparation of this study.
AUTHORS’ CONTRIBUTIONSH.A. Álvarez-Covarrubias: conceptualization, methodology, formal analysis, investigation, resources, writing, original draft preparation; N. Altaner: visualization, investigation; R. Adolf: resources, data curation; M. Jurisic: resources, data curation; E. Horban: resources, data curation; C. Pellegrini: resources, data curation; C. Duesmann: resources, data curation; M. Lachmann: resources, data curation; C. Thilo: resources, data curation; F. Syryca: supervision, data curation; M. Klos: supervision, data curation; N. P. Mayr: resources, data curation; T. Rheude: resources, data curation; M. Renker: supervision, data curation; E. I. Charitos: supervision, data curation; H. Schunkert: supervision, writing-reviewing and editing visualization; A. Kastrati: supervision, visualization, writing-reviewing and editing; E. Xhepa: writing, supervision; K. Won-Keun: writing, supervision, formal analysis; M. Joner: conceptualization, writing-reviewing and editing, project administration.