The variation between rest and peak stress end-systolic pressure-volume relation is an afterload-independent index of left ventricular contractility. Whether and to what extent it depends on end-diastolic volume remains unclear. The aim of this study was to assess the dependence of the delta rest-stress end-systolic pressure-volume relation on end-diastolic volume in patients with negative stress echo and all ranges of resting left ventricular function.
MethodsWe analyzed interpretable data obtained in 891 patients (593 men, age 63 ± 12 years) with ejection fraction 47% ± 12%: 338 were normal or near-normal or hypertensive; 229 patients had coronary artery disease; and 324 patients had ischemic or nonischemic dilated cardiomyopathy. They were studied with exercise (n = 172), dipyridamole (n = 482) or dobutamine (n = 237) stress echocardiography. The end-systolic pressure-volume relation was evaluated at rest and peak stress from raw measurement of systolic arterial pressure by cuff sphygmomanometer and end-systolic volume by biplane Simpson rule 2-dimensional echocardiography.
ResultsAbsolute values of delta rest-stress end-systolic pressure-volume relation were higher for exercise and dobutamine than for dipyridamole. In the overall population, an inverse relationship between end-systolic pressure-volume relation and end-diastolic volume was present at rest (r2 = 0.69, P < .001) and peak stress (r2 = 0.56, P < .001), but was absent if the delta rest-stress end-systolic pressure-volume relation was considered (r2 = 0.13).
ConclusionsLeft ventricular end-diastolic volume does not affect the rest-stress changes in end-systolic pressure-volume relation in either normal or abnormal left ventricles during physical or pharmacological stress.
Keywords
The slope of the pressure-volume relation at end-systole, termed Emax by Suga and Sagawa,1 has been considered for the assessment of contractile performance in view of its sensitivity to inotropic changes and relative independence from ventricular load. Because the determination of Emax requires obtaining pressure/volume curves at different loads, attempts have been made to identify a simplified index in humans.2 The variation between rest and peak stress end-systolic pressure-volume relation (ESPVR; the Suga index) is easily obtained during routine stress echocardiography and has been established as a reasonably load-independent index of myocardial contractile performance3–11 that allows a more accurate prognostic stratification than ejection fraction in patients without inducible wall motion abnormalities.12–15
However, like most indexes, the ESPVR does not take into account the diastolic dimensions of the left ventricle. Suga et al.16 reported the size dependence of Emax in experimental conditions and it has since been emphasized that left ventricular (LV) function indexes in humans should be normalized17,18 to enable comparisons of contractile function among patients. The present study was designed to relate the ESPVR index obtained during stress echocardiography at rest and the ΔESPVR (the difference between peak and rest ESPVR) to LV end-diastolic volume (LVEDV) in both normal controls and in patients.
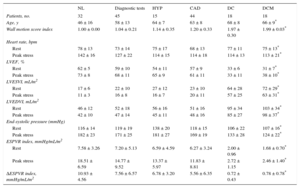
METHODSFrom January 2003, 1142 patients underwent stress echocardiography in quality-controlled stress echo laboratories.9,11,12,14,19–23 The study complied with the Declaration of Helsinki. Informed consent was obtained from all patients (or their guardians) before testing, and the study protocol was approved by the institutional ethics committee. Stress echo data were collected and analyzed by stress echocardiographers not involved in patient care. Exclusion criteria were significant congenital heart disease, unsatisfactory imaging of the left ventricle at rest or during stress, atrial fibrillation, or positive stress echocardiography. From the initial population of 1142 patients, 118 were excluded for stress echo positivity, 11 for congenital heart disease, 18 for atrial fibrillation, and 41 for unsatisfactory echo imaging. Thus, the study population included 891 patients, 593 (67%) men, 298 (33%) women; the mean age was 63 ± 12 years and mean ejection fraction was 47% ± 12%, with negative stress echo by wall motion criteria. Data were prospectively acquired and retrospectively analyzed. Patients were categorized ex-post as: normal, n = 91; idiopathic dilated cardiomyopathy, n = 222; known coronary artery disease, n = 331 (dilated ischemic cardiomyopathy, n = 102; not dilated, n = 229); diagnostic tests, n = 162, and hypertensive, n = 85.
The normal group was composed of participants with normal LV function in baseline conditions and at peak stress and were not receiving therapy at the time of testing. Diagnostic tests consisted of stress tests in patients with a low pretest probability of coronary artery disease, electrocardiogram (ECG) abnormalities at rest or exercise electrocardiography, and no LV dilation. Diagnosis of coronary artery disease was based upon history of myocardial infarction or coronary revascularization and/or the presence of ≥ 1 angiographically documented coronary stenosis > 50%.
The stressor used (exercise, dipyridamole, dobutamine) was chosen on the basis of specific contraindications, local facilities and physician preferences. Dobutamine was the preferred stressor for viability assessment.24
Two-dimensional echocardiography and 12-lead electrocardiographic monitoring were performed in combination with semisupine bicycle exercise, or high-dose (up to 40μg/kg/min) dobutamine, or high-dose dipyridamole (84mg/kg/min, over 6min), according to protocols suggested by the European Association of Echocardiography24 guidelines. During the procedure, blood pressure and ECG were recorded each minute. Echocardiographic images were semiquantitatively assessed using a 17-segment, 4-point scale model of the left ventricle.24 A wall motion score index was derived by dividing the sum of individual segment scores by the number of interpretable segments. The LV ejection fraction (LVEF) was assessed using the biplane Simpson method.25 Ischemia was defined as stress-induced new and/or worsening of a pre-existing wall motion abnormality, or biphasic response (ie, low-dose improvement followed by high-dose deterioration). By selection, all patients had negative stress echo by wall motion criteria. Improvement of the wall motion score index between resting and peak of stress indicated myocardial viability.26
The LV end-systolic volume (LVESV) and the LVEDV are obtained from apical 4-chamber and 2-chamber view using the biplane Simpson method.12,19,25 The LVESV and the LVEDV are assessed at rest and at peak stress and normalized by dividing it by body surface area. Only representative cycles with optimal endocardial visualization are measured and the average of 3 measurements are taken. The endocardial border is traced, excluding the papillary muscles. The frame with the smallest LV cavity is considered to be the end-systolic frame and the frame captured at the R wave of the ECG is considered to be the end-diastolic frame. The LV end-systolic pressure (mmHg) is obtained as LV end-systolic pressure = 0.9 × systolic blood pressure (mmHg), a noninvasive estimate of end-systolic pressure that accurately predicts pressure-volume loop measurements of end-systolic pressure.27
The ESPVR (mmHg/mL/m2) is obtained as the ratio of the end-systolic pressure to the LVESV indexed for body surface area. The ESPVR is determined at rest and at peak stress. The ΔESPVR is calculated as the variation between rest and peak stress ESPVR. The rest ESPVR, the peak stress ESPVR and the ΔESPVR are built offline.11,12,19
Statistical AnalysisThe statistical analysis was performed using SPSS 22 for Windows and included descriptive statistics (frequency and percentage of categorical variables and mean ± standard deviation of continuous variables). Pearson's chi-square test with Fisher's exact test for categorical variables and the Mann-Whitney test for continuous variables for intergroup comparisons were performed to confirm significance (using the Monte Carlo method for small sample comparisons). One-way ANOVA (analysis of variance) was used to compare continuous variables between groups; when homogeneity of variance was absent, the Kruskal-Wallis test for nonparametric independent samples was used. The relation between the ESPVR and the LVEDV was determined within each group by linear regression analysis using the least squares method. Comparison of means was performed using the t-test. For all analyses, significance was assigned at P < .05.
RESULTSAll studies were performed by an experienced cardiologist with documented experience in stress echocardiography and who passed the quality-control procedures of stress echocardiography reading according to the criteria adopted in the Echo Persantine International Cooperative and in the Echo Dobutamine International Cooperative multicenter studies.26 By selection, 2-dimensional measurements of LV volumes were feasible in all patients. By selection, no test was interrupted because of limiting side effects and no test was positive for regional wall motion abnormalities. Moderate mitral regurgitations were included: 89 (40%) of the 222 patients with idiopathic dilated cardiomyopathy, 47 (46%) of the 102 patients with ischemic dilated cardiomyopathy, and 6 (3%) of the 229 patients with ischemic heart disease had moderate mitral regurgitation. The 331 dilated heart patients with or without moderate mitral regurgitation had similar resting LVEF (28% ± 7% vs 29% ± 9%, P = ns) and ΔESPVR (0.92 ± 2mmHg/mL/m2 vs 0.87 ± 1.6mmHg/mL/m2, P = ns).
In 60 randomly selected patients, there was excellent interobserver agreement with the Bland Altman method with mean ± standard deviation for LVEDV at rest (2.3 ± 18mL; 95% confidence interval [95%CI], −38 mL to 34 mL) and at peak stress (5.8 ± 16mL; 95%CI, −38mL to 26mL), LVESV at rest (3.6 ± 23mL; 95%CI, −48 to 41mL) and at peak stress (0.3 ± 13mL; 95%CI, −27 to 27mL). Variability was lower for LVEDV and LVESV both for pharmacological and exercise echo at low heart rates (< 100 bpm) at peak stress.
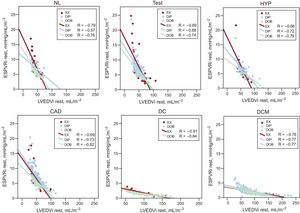
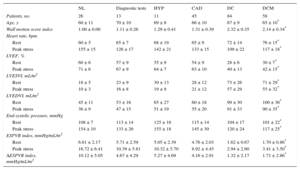
Left ventricular volumes and stress-related variables are presented separately for exercise, dipyridamole and dobutamine stress echo in Table 1, Table 2, and Table 3. At rest, an inverse relation was observed for normal participants and each group of patients between the ESPVR and the end-diastolic volume (ie, the larger the LV cavity, the smaller the ESPVR) (Figure 1). The slope of the ESPVR/LVEDV index (a marker of the size dependence of the end-systolic pressure/volume ratio) was significantly different between dilated ischemic cardiomyopathy, dilated idiopathic cardiomyopathy, and other groups, as the slope was steeper in patients without dilated left ventricle (Figure 1, upper panels). At a given end-diastolic volume, the mean end-systolic pressure/volume ratio was higher in the nondilated patient groups than in the dilated ischemic cardiomyopathy and dilated idiopathic cardiomyopathy groups (Figure 1, lower panels).
Exercise Stress Echocardiography. Left Ventricular Volumes and Stress-related Variables
| NL | Diagnostic tests | HYP | CAD | DC | DCM | |
|---|---|---|---|---|---|---|
| Patients, no. | 32 | 45 | 15 | 44 | 18 | 18 |
| Age, y | 46 ± 16 | 58 ± 13 | 64 ± 7 | 63 ± 8 | 68 ± 8 | 66 ± 9* |
| Wall motion score index | 1.00 ± 0.00 | 1.04 ± 0.21 | 1.14 ± 0.35 | 1.20 ± 0.33 | 1.97 ± 0.30 | 1.99 ± 0.03* |
| Heart rate, bpm | ||||||
| Rest | 78 ± 13 | 73 ± 14 | 75 ± 17 | 68 ± 13 | 77 ± 11 | 75 ± 13* |
| Peak stress | 142 ± 16 | 127 ± 22 | 114 ± 15 | 114 ± 18 | 114 ± 13 | 113 ± 21* |
| LVEF, % | ||||||
| Rest | 62 ± 5 | 59 ± 10 | 54 ± 11 | 57 ± 9 | 33 ± 6 | 31 ± 7* |
| Peak stress | 73 ± 8 | 68 ± 11 | 65 ± 9 | 61 ± 11 | 33 ± 11 | 38 ± 10* |
| LVESVI, mL/m2 | ||||||
| Rest | 17 ± 6 | 22 ± 10 | 27 ± 12 | 23 ± 10 | 64 ± 28 | 72 ± 29* |
| Peak stress | 11 ± 3 | 16 ± 8 | 16 ± 7 | 20 ± 11 | 57 ± 25 | 63 ± 31* |
| LVEDVI, mL/m2 | ||||||
| Rest | 46 ± 12 | 52 ± 18 | 56 ± 16 | 51 ± 16 | 95 ± 34 | 103 ± 34* |
| Peak stress | 42 ± 10 | 47 ± 14 | 45 ± 11 | 48 ± 16 | 85 ± 27 | 98 ± 37* |
| End-systolic pressure (mmHg) | ||||||
| Rest | 116 ± 14 | 119 ± 19 | 138 ± 20 | 118 ± 15 | 106 ± 22 | 107 ± 16* |
| Peak stress | 182 ± 23 | 171 ± 25 | 181 ± 27 | 169 ± 19 | 133 ± 28 | 124 ± 22* |
| ESPVR index, mmHg/mL/m2 | ||||||
| Rest | 7.58 ± 3.26 | 7.20 ± 5.13 | 6.59 ± 4.59 | 6.27 ± 3.24 | 2.00 ± 0.96 | 1.68 ± 0.70* |
| Peak stress | 18.51 ± 6.59 | 14.77 ± 9.52 | 13.37 ± 5.97 | 11.83 ± 8.81 | 2.72 ± 1.15 | 2.46 ± 1.40* |
| ΔESPVR index, mmHg/mL/m2 | 10.93 ± 4.56 | 7.56 ± 6.57 | 6.78 ± 3.20 | 5.56 ± 6.35 | 0.72 ± 0.43 | 0.78 ± 0.78* |
ΔESPVR, variation between rest and peak stress ESPVR; CAD, coronary artery disease; DC, dilated ischemic cardiomyopathy; DCM, idiopathic dilated cardiomyopathy; ESPVR, end-systolic pressure-volume relation; HYP, hypertensive participants; LVEDVI, left ventricular end-diastolic volume index; LVEF, left ventricular ejection fraction; LVESVI, left ventricular end-systolic volume index; NL, normal participants.
Unless otherwise indicated, the data are expressed as mean ± standard deviation.
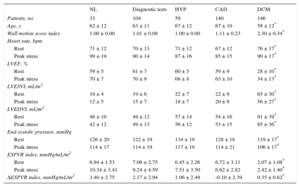
Dipyridamole Stress Echocardiography. Left Ventricular Volumes and Stress-related Variables
| NL | Diagnostic tests | HYP | CAD | DCM | |
|---|---|---|---|---|---|
| Patients, no. | 33 | 104 | 59 | 140 | 146 |
| Age, y | 62 ± 12 | 63 ± 11 | 67 ± 12 | 67 ± 10 | 58 ± 12* |
| Wall motion score index | 1.00 ± 0.00 | 1.01 ± 0.08 | 1.00 ± 0.00 | 1.11 ± 0.23 | 2.30 ± 0.34* |
| Heart rate, bpm | |||||
| Rest | 71 ± 12 | 70 ± 13 | 71 ± 12 | 67 ± 12 | 76 ± 17* |
| Peak stress | 99 ± 19 | 90 ± 14 | 87 ± 16 | 85 ± 15 | 90 ± 17* |
| LVEF, % | |||||
| Rest | 59 ± 5 | 61 ± 7 | 60 ± 5 | 59 ± 9 | 28 ± 10* |
| Peak stress | 70 ± 7 | 70 ± 9 | 68 ± 8 | 63 ± 10 | 34 ± 13* |
| LVESVI, mL/m2 | |||||
| Rest | 19 ± 4 | 19 ± 6 | 22 ± 7 | 22 ± 9 | 65 ± 30* |
| Peak stress | 12 ± 5 | 15 ± 7 | 18 ± 7 | 20 ± 9 | 56 ± 27* |
| LVEDVI, mL/m2 | |||||
| Rest | 46 ± 10 | 49 ± 12 | 57 ± 14 | 54 ± 16 | 91 ± 39* |
| Peak stress | 42 ± 12 | 49 ± 13 | 56 ± 12 | 53 ± 15 | 85 ± 36* |
| End-systolic pressure, mmHg | |||||
| Rest | 126 ± 20 | 122 ± 19 | 134 ± 19 | 128 ± 18 | 119 ± 17* |
| Peak stress | 114 ± 17 | 114 ± 19 | 117 ± 19 | 114 ± 21 | 106 ± 17* |
| ESPVR index, mmHg/mL/m2 | |||||
| Rest | 6.94 ± 1.53 | 7.06 ± 2.75 | 6.45 ± 2.26 | 6.72 ± 3.11 | 2.07 ± 1.08* |
| Peak stress | 10.34 ± 3.41 | 9.24 ± 4.59 | 7.51 ± 3.50 | 6.62 ± 2.82 | 2.42 ± 1.40* |
| ΔESPVR index, mmHg/mL/m2 | 3.40 ± 2.75 | 2.17 ± 2.94 | 1.06 ± 2.49 | -0.10 ± 2.39 | 0.35 ± 0.62* |
ΔESPVR, variation between rest and peak stress ESPVR; CAD, coronary artery disease; DC, dilated ischemic cardiomyopathy; DCM, idiopathic dilated cardiomyopathy; ESPVR, end-systolic pressure-volume relation; HYP, hypertensive participants; LVEDVI, left ventricular end-diastolic volume index; LVEF, left ventricular ejection fraction; LVESVI, left ventricular end-systolic volume index; NL, normal participants.
Unless otherwise indicated, the data are expressed as mean ± standard deviation.
Dobutamine Stress Echocardiography. Left Ventricular Volumes and Stress-related Variables
| NL | Diagnostic tests | HYP | CAD | DC | DCM | |
|---|---|---|---|---|---|---|
| Patients, no. | 26 | 13 | 11 | 45 | 84 | 58 |
| Age, y | 60 ± 11 | 70 ± 10 | 69 ± 8 | 66 ± 10 | 67 ± 9 | 65 ± 10* |
| Wall motion score index | 1.00 ± 0.00 | 1.11 ± 0.26 | 1.29 ± 0.41 | 1.31 ± 0.39 | 2.32 ± 0.35 | 2.14 ± 0.34* |
| Heart rate, bpm | ||||||
| Rest | 60 ± 5 | 65 ± 7 | 68 ± 19 | 65 ± 9 | 72 ± 14 | 76 ± 15* |
| Peak stress | 155 ± 15 | 126 ± 17 | 142 ± 21 | 133 ± 15 | 109 ± 22 | 117 ± 18* |
| LVEF, % | ||||||
| Rest | 60 ± 6 | 57 ± 9 | 55 ± 9 | 54 ± 9 | 28 ± 6 | 30 ± 7* |
| Peak stress | 71 ± 6 | 67 ± 9 | 64 ± 7 | 63 ± 10 | 40 ± 13 | 42 ± 15* |
| LVESVI, mL/m2 | ||||||
| Rest | 18 ± 5 | 23 ± 9 | 30 ± 13 | 28 ± 12 | 73 ± 26 | 71 ± 29* |
| Peak stress | 10 ± 3 | 16 ± 8 | 19 ± 9 | 21 ± 12 | 57 ± 29 | 55 ± 32* |
| LVEDVI, mL/m2 | ||||||
| Rest | 45 ± 11 | 53 ± 16 | 65 ± 27 | 60 ± 18 | 99 ± 30 | 100 ± 36* |
| Peak stress | 36 ± 9 | 47 ± 15 | 51 ± 19 | 55 ± 20 | 91 ± 33 | 90 ± 35* |
| End-systolic pressure, mmHg | ||||||
| Rest | 108 ± 7 | 113 ± 14 | 125 ± 16 | 115 ± 14 | 104 ± 17 | 101 ± 22* |
| Peak stress | 154 ± 10 | 133 ± 26 | 155 ± 18 | 145 ± 30 | 120 ± 24 | 117 ± 25* |
| ESPVR index, mmHg/mL/m2 | ||||||
| Rest | 6.61 ± 2.17 | 5.71 ± 2.59 | 5.05 ± 2.39 | 4.76 ± 2.03 | 1.62 ± 0.67 | 1.70 ± 0.86* |
| Peak stress | 16.72 ± 6.41 | 10.39 ± 5.81 | 10.32 ± 5.70 | 8.92 ± 4.45 | 2.94 ± 2.60 | 3.41 ± 3.50* |
| ΔESPVR index, mmHg/mL/m2 | 10.12 ± 5.05 | 4.67 ± 4.29 | 5.27 ± 4.69 | 4.16 ± 2.91 | 1.32 ± 2.17 | 1.71 ± 2.86* |
ΔESPVR, variation between rest and peak stress ESPVR; CAD, coronary artery disease; DC, dilated ischemic cardiomyopathy; DCM, idiopathic dilated cardiomyopathy; ESPVR, end-systolic pressure-volume relation; HYP, hypertensive participants; LVEDVI, left ventricular end-diastolic volume index; LVEF, left ventricular ejection fraction; LVESVI, left ventricular end-systolic volume index; NL, normal participants.
Unless otherwise indicated, the data are expressed as mean ± standard deviation.
, DIP (blue symbols) and DOB (green symbols). For each group of patients, linear regression values are represented. CAD, coronary artery disease; DC, dilated ischemic cardiomyopathy; DCM, idiopathic dilated cardiomyopathy; DIP, dipyridamole stress echo; DOB, dobutamine stress echo; ESPVRi, end-systolic pressure-volume relation index; EX, exercise stress echo; HYP, hypertensive participants; LVEDVi, left ventricular end-diastolic volume index; NL, normal participants; Test, diagnostic test patients.")
Relationships between ESPVRi and the LVEDVi at rest. The relationships between the LVEDVi and the ESPVRi are presented separately for the patients scheduled for EX (red symbols), DIP (blue symbols) and DOB (green symbols). For each group of patients, linear regression values are represented. CAD, coronary artery disease; DC, dilated ischemic cardiomyopathy; DCM, idiopathic dilated cardiomyopathy; DIP, dipyridamole stress echo; DOB, dobutamine stress echo; ESPVRi, end-systolic pressure-volume relation index; EX, exercise stress echo; HYP, hypertensive participants; LVEDVi, left ventricular end-diastolic volume index; NL, normal participants; Test, diagnostic test patients.
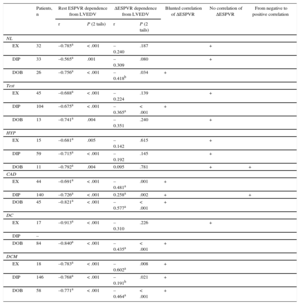
In the overall population, an inverse relationship between ESPVR and LVEDV was present at rest (r2 = 0.69, P < .001) and peak stress (r2 = 0.56, P < .001), but was absent if only the ΔESPVR was considered (r2 = 0.13). The ΔESPVR value was highest for normal or near-normal or hypertensive individuals and was lowest for ischemic or nonischemic dilated cardiomyopathy patients. Absolute values of ΔESPVR were higher for exercise and dobutamine than for dipyridamole. At peak stress, as at baseline, an inverse relation was observed for normal individuals and each group of patients between the ESPVR and the end-diastolic volume (ie, the larger the LV cavity, the smaller the end-systolic pressure/volume ratio) both for the exercise stress, dipyridamole stress, and dobutamine stress groups.
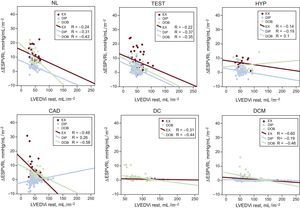
The end-diastolic volume dependence of the ESPVR disappeared and/or significantly decreased vs rest when we considered the ΔESPVR (Table 4). The relationships between the LVEDV and the ΔESPVR are presented separately for the exercise, dipyridamole, and dobutamine stress echo groups (Figure 2, color symbols), and for normal participants and patients inside the stress group (Figure 2, upper and lower panels).
Size Dependence of the End-systolic Pressure-volume Relation at Rest and During Stress
| Patients, n | Rest ESPVR dependence from LVEDV | ΔESPVR dependence from LVEDV | Blunted correlation of ΔESPVR | No correlation of ΔESPVR | From negative to positive correlation | |||
|---|---|---|---|---|---|---|---|---|
| r | P (2 tails) | r | P (2 tails) | |||||
| NL | ||||||||
| EX | 32 | –0.785a | < .001 | –0.240 | .187 | + | ||
| DIP | 33 | –0.565a | .001 | –0.309 | .080 | + | ||
| DOB | 26 | –0.756a | < .001 | –0.418b | .034 | + | ||
| Test | ||||||||
| EX | 45 | –0.688a | < .001 | –0.224 | .139 | + | ||
| DIP | 104 | –0.675a | < .001 | –0.365a | < .001 | + | ||
| DOB | 13 | –0.741a | .004 | –0.351 | .240 | + | ||
| HYP | ||||||||
| EX | 15 | –0.681a | .005 | –0.142 | .615 | + | ||
| DIP | 59 | –0.715a | < .001 | –0.192 | .145 | + | ||
| DOB | 11 | –0.792a | .004 | 0.095 | .781 | + | + | |
| CAD | ||||||||
| EX | 44 | –0.691a | < .001 | –0.481a | .001 | + | ||
| DIP | 140 | –0.726a | < .001 | 0.258a | .002 | + | + | |
| DOB | 45 | –0.821a | < .001 | –0.577a | < .001 | + | ||
| DC | ||||||||
| EX | 17 | –0.913a | < .001 | –0.310 | .226 | + | ||
| DIP | – | |||||||
| DOB | 84 | –0.840a | < .001 | –0.435a | < .001 | + | ||
| DCM | ||||||||
| EX | 18 | –0.783a | < .001 | –0.602a | .008 | + | ||
| DIP | 146 | –0.768a | < .001 | –0.191b | .021 | + | ||
| DOB | 58 | –0.771a | < .001 | –0.464a | < .001 | + | ||
ΔESPVR, variation between rest and peak stress ESPVR; CAD, coronary artery disease; DC, dilated ischemic cardiomyopathy; DCM, idiopathic dilated cardiomyopathy; DIP, dipyridamole stress echo; DOB, dobutamine stress echo; ESPVR, end-systolic pressure-volume relation; EX, exercise stress echo; HYP, hypertensive participants; LVEDV, left ventricular end-diastolic volume; NL, normal participants; Test, diagnostic tests.
, DIP (blue symbols) and DOB (green symbols). ΔESPVRi, end-systolic pressure-volume relation index changes with stress; CAD, coronary artery disease; DC, dilated ischemic cardiomyopathy; DCM, idiopathic dilated cardiomyopathy; DIP, dipyridamole stress echo; DOB, dobutamine stress echo; EX, exercise stress echo; HYP, hypertensives; LVEDVi, left ventricular end-diastolic volume index at rest; NL, normals; Test, diagnostic test patients.")
Relationships between ΔESPVRi and the LVEDVi. For each group of patients, linear regression values are represented. The relationships between the LVEDVi and the ΔESPVRi are presented separately for the patients who underwent EX (red symbols), DIP (blue symbols) and DOB (green symbols). ΔESPVRi, end-systolic pressure-volume relation index changes with stress; CAD, coronary artery disease; DC, dilated ischemic cardiomyopathy; DCM, idiopathic dilated cardiomyopathy; DIP, dipyridamole stress echo; DOB, dobutamine stress echo; EX, exercise stress echo; HYP, hypertensives; LVEDVi, left ventricular end-diastolic volume index at rest; NL, normals; Test, diagnostic test patients.
The end-systolic pressure /end-systolic volume index ratio (the Suga index) at increasing heart rates is easily obtained during routine stress echocardiography and has been established as a reasonably load-independent index of myocardial contractile performance.3–11 However, like most indexes, this ratio does not take into account the diastolic dimensions of the left ventricle.
End-systolic Pressure-volume Ratio and End-diastolic Volume Relation at RestThe end-systolic pressure/volume ratio is currently recognized as a relatively load-independent index of myocardial contractile performance, but its dependence on ventricular size may limit its value for interpatient comparisons. Foult et al.28 provided evidence that the end-systolic stress/volume ratio is highly dependent on the size of the LV chamber in humans and that this dependence differs according to the nature of the underlying myocardial disease. Our results demonstrate a linear inverse relation between the end-systolic pressure/volume ratio and the LVEDV in patients with a normal left ventricle and in patients with diseased hearts. The range of variation of the end-systolic pressure/volume ratio was such that 2 patients whose value for end-diastolic volume differed by 50% would have a ≈ 30% difference in end-systolic pressure/volume ratio. This relation probably occurs because, whereas aortic pressure is relatively constant, a larger ventricle would have a greater end-systolic volume. Thus, the end-systolic pressure/volume ratio will be lower in a large ventricle than in a smaller heart, even though contractile performance may be presumed to be the same. These findings agree with previous data29 showing that the normal ventricle of a child has a greater slope of pressure-volume relation at end-systole than does the normal ventricle of an adult. Therefore, the comparison of the inotropic state of the ventricle in patients with different diseases by means of the end-systolic pressure/volume ratio at rest and probably at peak stress is affected by the dependence of this index on chamber size. Although this dependence was suggested in previous reports,16–18 it has not been confirmed in a large number of patients. The present study included a large series of patients with a normal ventricle, as well as patients with various types of ventricular hypertrophy or dilation, or both, and therefore provides data that may settle the problem in the clinical assessment of LV function.
End-systolic Pressure-volume Ratio and End-diastolic Volume Relation at Peak StressThe data from this study demonstrated that at peak stress (as at rest) the end-systolic pressure/volume ratio was affected by the dependence of this index on chamber size, especially in patients with dilated ischemic or idiopathic cardiomyopathy or both. An inverse relation between the ESPVR and the LVEDV was found in patients with a normal left ventricle and in patients with a dilated heart.28 The size dependence of the ESPVR has led to several “normalizations”; however, in previous reports these attempts were not successful, and normalized indexes were still dependent on ventricular size.
End-systolic Pressure-volume Ratio Changes With Stress and Independence From the Left Ventricular End-diastolic VolumeThe end-diastolic volume dependence of the ESPVR disappeared and /or was significantly lower when we considered the ΔESPVR. Pearson's correlation and significances for normal individuals and patients in the stress group are shown in Table 4. Consequently, the ΔESPVR, instead of the rest or the peak ESPVR value, displays little sensitivity on the loading conditions, but also little dependence on the size of the ventricle.12,19,22 The ΔESPVR is most strongly linked with peak hemodynamic response and stress systolic function, both of which are central clinical determinants of LV contractility and contractile reserve.30,31 These data emphasize the size independence of the ΔESPVR vs rest or the peak ESPVR value and its consequence for comparative assessments of patients.
Ten years ago, ΔESPVR was introduced in the stress echo laboratory as a measure of the heart rate-dependent changes in contractility, associated or not with adrenergic stimulation.10,12,19 The feasibility and the reproducibility of measurements was consistently reported as very high in all studies, with all forms of stresses, and in different patient populations–from ischemic or idiopathic dilated cardiomyopathy to severe mitral insufficiency.7,8,12,23
Although the clinical and scientific impact of stress echo is based, for many good reasons, upon the merits of regional wall motion abnormalities over insensitive global indices of LV function such as LVEF the appealingly simple ΔESPVR approach stirred new interest in the information present in the entire left ventricle which is absent in regional function.15 Unlike LVEF, the LV elastance reserve is independent from afterload and—as the current study shows—from LV diastolic dimensions, and is more useful than ejection fraction reserve for diagnostic and prognostic stratification, with different stressors.10–12,19,20
LimitationsThe noninvasive assessment of ESPVR is based on the equation: ESPVR = (end-systolic pressure / end-systolic volume index - V0) and assumes that V0 (the theoretical volume when no pressure is generated) is negligible compared with end-systolic volume. Chen et al.32 found that the calculation of end-systolic pressure from 0.9 × brachial systolic blood pressure reasonably approximated end-systolic pressure measured invasively: the correlation coefficient between the 2 variables was 0.75, and the regression line had a slope of 1.01 (P < .0001).
The formula used to noninvasively estimate end-systolic pressure (0.9 × systolic blood pressure) has not been validated during exercise. In this regard, methodologies that use radial applanation tonometry may be of help as they allow noninvasive and accurate estimates of central systolic blood pressure at rest and during exercise, at least in the supine position and at low intensities of exercise.33 Blood pressure measurements are simpler and more accurate during pharmacological stress echocardiography (dipyridamole or dobutamine) since no movement-related artifacts can occur.24 In addition, volume measurement is simpler during pharmacological stress echocardiography, with the patient lying down on the left side, for an optimal visualization of the cardiac structures, especially during dipyridamole stress echo, due to the low heart rate values at peak stress. Volumes were assessed by 2-dimensional echocardiography. The measurements would have been more accurate and reproducible with real-time 3-dimensional echocardiography, which is certainly feasible and can be applied to the assessment of LV and arterial elastance in the echo laboratory. However, we retrospectively analyzed patients studied for clinically-driven indications in high-volume stress echo laboratories, and in this real-world setting, in the time-window considered,26 there was no place for the use of complex, expensive and at that time technically demanding technologies such as real-time 3-dimensional echocardiography. The variability of measurements was low at baseline and during stress, but due to the study design, the inter-acquisition variability, which is also important, could not be assessed.
CONCLUSIONSThese data emphasize the size independence of the ΔESPVR and its consequences for a comparative assessment of a large number of patients with different diseases. The LVEDV does not affect rest-stress changes in ESPVR in either normal or abnormal left ventricles during physical or pharmacological stress.
CONFLICTS OF INTERESTNone declared.
- -
Starting in 2003, the pressure-volume relationship was introduced in the stress-echo laboratory by using the ESPVR at increasing heart rates.
- -
The ΔESPVR is easily obtained during routine stress echocardiography and has been established as an afterload-independent index of LV contractility.
- -
Several peer-reviewed articles have demonstrated the clinical usefulness of ΔESPVR for diagnosing latent contractile dysfunction in apparently normal hearts and residual contractile reserve in dilated idiopathic and ischemic cardiomyopathy.
- -
The prognostic stratification of patients was better with ΔESPVR, beyond the standard LVEF evaluation. Whether ΔESPVR depends upon end-diastolic volume remains unclear.
- -
This study shows the independence of LV ΔESPVR from LVEDV size.
- -
This is a pathophysiologically important concept, which we tested for exercise, dobutamine and dipyridamole stressors in all patient populations (from normal LV function to dilated cardiomyopathy).
- -
With this information, we have a sound pathophysiological platform to study the LV elastance reserve with all 3 stresses in different patient populations.
- -
Unlike LVEF, the LV elastance reserve (ΔESPVR) is independent from afterload and—as the current study shows—from LV diastolic dimensions.
We are grateful to Alison Frank for copyediting/proofreading the English in this manuscript.