There is limited evidence to identify the most accurate method for measuring the mitral valve area (MVA) after percutaneous edge-to-edge mitral repair. Our objective was to evaluate the optimal method in this context and its correlation with the mean transmitral gradient.
MethodsA registry of patients undergoing percutaneous mitral repair was conducted, analyzing different methods of measuring MVA and their correlation with the mean gradient.
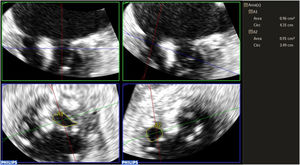
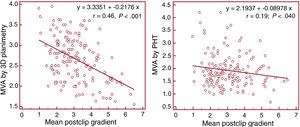
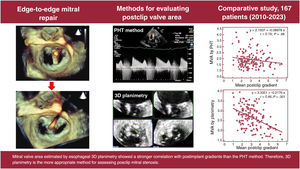
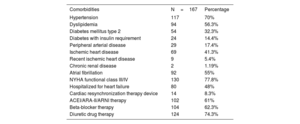
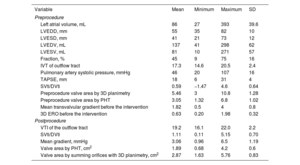
ResultsWe analyzed data from 167 patients. The mean age was 76±10.3 years, 54% were men, and 46% were women. Etiology was degenerative in 45%, functional in 39%, and mixed in 16%. Postclip MVA measurements were 1.89±0.60 cm2 using pressure half-time (PHT), 2.87±0.83 cm2 using 3D planimetry, and the mean gradient was 3±1.19mmHg. MVA using 3D planimetry showed a stronger correlation with the mean gradient (r=0.46, P<.001) than MVA obtained by PHT (r=0.19, P=.048). Interobserver agreement was also higher with 3D planimetry than with PHT (intraclass correlation coefficient of 0.90 vs 0.81 and variation coefficient of 9.6 vs 19.7%, respectively).
ConclusionsOur study demonstrates that the PHT method significantly underestimates MVA after clip implantation compared with direct measurement using transesophageal 3D planimetry. The latter method also correlates better with postimplantation gradients and has less interobserver variability. These results suggest that 3D planimetry is a more appropriate method for assessing postclip mitral stenosis.
Keywords
Percutaneous edge-to-edge mitral valve repair is a well-established alternative for treating mitral regurgitation in patients at high surgical risk.1,2 The procedure aims to mimic Alfieri's technique, involving placement of a clip between the leaflets, usually between A2 and P2. This creates a double orifice for diastolic filling that can reduce the severity of mitral regurgitation and alleviate symptoms in appropriately selected patients.1,3
Echocardiographic monitoring is essential during the intervention to guide implantation, evaluate outcomes, and identify potential procedure-related complications.4,5 A key factor to assess is the presence of mitral stenosis caused by the clip, which should be determined before its release.1–3 If stenosis is significant, the device should be withdrawn without implantation.4,5 Significant valve stenosis, defined as a mitral valve area (MVA)<1.5cm2, is uncommon when 1 or 2 clips are implanted, and there is no evidence of progression at 4 years’ follow-up.3 Regarding the mean transmitral gradient, a cutoff of 5mmHg is used to predict elevated gradients at hospital discharge.4 Additional clips should not be implanted if the mean gradient is >5mmHg.5,6
The traditional approach to assessing MVA using the pressure half-time (PHT) method was originally validated for evaluating mitral stenosis in rheumatic native valves. However, this method lacks adequate validation in the context of percutaneous edge-to-edge mitral repair.7,8 Although PHT is easy to perform, several factors can affect the correlation of PHT results with MVA. These factors include diastolic dysfunction, a reduced slope in cases of significant aortic regurgitation, and decreased left ventricular distensibility, as seen in degenerative mitral stenosis.9 Three-dimensional (3D) planimetry of residual orifices is a promising method to optimize MVA reproducibility, as it is unaffected by hemodynamic conditions, ventricular distensibility, or the presence of other valve pathologies.9,10 In routine clinical practice, most centers have begun using this technique to evaluate residual MVA following clip implantation.1,11 However, 3D planimetry is not free from limitations. Tracing can be challenging due to variations in orifice geometry and valve calcifications; hence, it also depends on the operator's experience.9,11 This study aimed to determine which of 2 methods for measuring MVA—PHT and 3D planimetry—is more reproducible and correlates better with postclip transmitral gradients.
METHODSA prospective registry was created, including 167 consecutive patients who underwent percutaneous edge-to-edge mitral valve repair at our center from October 2010 to May 2023. Transesophageal echocardiography for the procedure was performed using a Philips Epic 7 system and X7-2t probe (Philips Medical Systems, United States). All measurements were carried out in accordance with clinical practice guidelines.1,4,8 Continuous Doppler with transesophageal echocardiography was used in the catheterization laboratory immediately before starting the procedure and after releasing the last clip to evaluate the mean transmitral gradient and MVA using the PHT method.9 The Doppler beam was positioned at the center of the largest orifice to obtain a high-quality Doppler spectrum. For both the gradient and PHT measurements, the average of 3 beats was used, while 5 beats were averaged in patients with atrial fibrillation. If transmitral flow showed 3 slopes, an initial steep slope followed by a more gradual one, the mid-diastolic segment was used for PHT calculations, as recommended in clinical practice guidelines.1,4,8 In addition, 3D zoom acquisitions of the mitral valve were performed to measure MVA by 3D planimetry using Philips Medical Systems 3D quantification software (3DQ) (figure 1). The mitral valve is shown using 3 orthogonally oriented planes. To avoid overestimating the MVA, the plane used for measurement is oriented perpendicular to the valve leaflets.10,11 After clip placement, the 3D area of each orifice was measured separately, as the orifices typically have different orientations in space (figure 1). The total MVA was then calculated by summing the areas of both orifices. The study was approved by the hospital's research ethics committee.
To evaluate the effect of interobserver variability, a second independent researcher analyzed 20 randomly selected cases. Both professionals were experienced in the techniques, having used PHT and 3D planimetry for several years. Each reader determined the MVA using the classic PHT method and 3D planimetry on the same 2D and 3D acquisitions, as described above. Both readers were blinded to the previous measurements.
Statistical analysisAll statistical analyses were carried out using SPSS version 23.0 (SPSS Inc, United States) and MedCalc version 22 (MedCalc Software, Belgium). Continuous variables are expressed as mean ± standard deviation (SD), and categorical data as percentages and absolute frequencies. Linear regression and the Pearson r coefficient were used to analyze correlations between continuous variables. Interobserver reproducibility was evaluated using intraclass correlation coefficients and coefficients of variation (calculated as the SD of the difference between 2 measurements, divided by the mean value). P values <.05 were considered statistically significant.
RESULTSIn total, 167 patients were included in the study (n=167), 91 men (54%) and 76 women (46%). The mean age of participants was 76 years, ranging from 33 to 95 years (SD±10). The key clinical characteristics of the study population included hypertension (70%), diabetes mellitus (56.3%), a history of ischemic heart disease (41.3%), New York Heart Association functional class III/IV (77.8%), and atrial fibrillation (55%) (table 1). In addition, 48% required at least 1 hospital admission for heart failure. Regarding pharmacological treatment, 61% received angiotensin-converting enzyme inhibitors, angiotensin II receptor antagonists, or angiotensin receptor-neprilysin inhibitors, 62% beta-blockers, and 74% diuretics. Prior to the percutaneous mitral repair procedure, 8% had a cardiac resynchronization therapy device. The etiology of mitral regurgitation was predominantly degenerative (45%), followed by a functional cause (39%), and in a smaller percentage, a mixed etiology (16%). The type and number of devices used are shown in table 2. In patients receiving a PASCAL device, at least 2 devices were required in a higher percentage of cases (100% and 42%, respectively).
Clinical characteristics of the study population
| Comorbidities | N=167 | Percentage |
|---|---|---|
| Hypertension | 117 | 70% |
| Dyslipidemia | 94 | 56.3% |
| Diabetes mellitus type 2 | 54 | 32.3% |
| Diabetes with insulin requirement | 24 | 14.4% |
| Peripheral arterial disease | 29 | 17.4% |
| Ischemic heart disease | 69 | 41.3% |
| Recent ischemic heart disease | 9 | 5.4% |
| Chronic renal disease | 2 | 1.19% |
| Atrial fibrillation | 92 | 55% |
| NYHA functional class III/IV | 130 | 77.8% |
| Hospitalized for heart failure | 80 | 48% |
| Cardiac resynchronization therapy device | 14 | 8.3% |
| ACEI/ARA-II/ARNI therapy | 102 | 61% |
| Beta-blocker therapy | 104 | 62.3% |
| Diuretic drug therapy | 124 | 74.3% |
ACEI, angiotensin-converting enzyme inhibitor; ARA-II, angiotensin II receptor antagonist; ARNI, angiotensin receptor-neprilysin inhibitor; NYHA, New York Heart Association.
The preprocedure and immediate postprocedure echocardiographic characteristics are shown in table 3. The mean end-diastolic volume was 137mL, with mild to moderate systolic dysfunction (mean ejection fraction, 45%).
Preprocedure and immediate postprocedure echocardiographic characteristics of the study population
| Variable | Mean | Minimum | Maximum | SD |
|---|---|---|---|---|
| Preprocedure | ||||
| Left atrial volume, mL | 86 | 27 | 393 | 39.6 |
| LVEDD, mm | 55 | 35 | 82 | 10 |
| LVESD, mm | 41 | 21 | 73 | 12 |
| LVEDV, mL | 137 | 41 | 298 | 62 |
| LVESV, mL | 81 | 10 | 271 | 57 |
| Fraction, % | 45 | 9 | 75 | 16 |
| IVT of outflow tract | 17.3 | 14.6 | 20.5 | 2.4 |
| Pulmonary artery systolic pressure, mmHg | 46 | 20 | 107 | 16 |
| TAPSE, mm | 18 | 6 | 31 | 4 |
| SVti/DVti | 0.59 | −1.47 | 4.6 | 0.64 |
| Preprocedure valve area by 3D planimetry | 5.46 | 3 | 10.8 | 1.28 |
| Preprocedure valve area by PHT | 3.05 | 1.32 | 6.8 | 1.02 |
| Mean transvalvular gradient before the intervention | 1.82 | 0.5 | 4 | 0.8 |
| 3D ERO before the intervention | 0.63 | 0.20 | 1.98 | 0.32 |
| Postprocedure | ||||
| VTI of the outflow tract | 19.2 | 16.1 | 22.0 | 2.2 |
| SVti/DVti | 1.11 | 0.11 | 5.15 | 0.70 |
| Mean gradient, mmHg | 3.06 | 0.96 | 6.5 | 1.19 |
| Valve area by PHT, cm2 | 1.89 | 0.68 | 4.2 | 0.6 |
| Valve area by summing orifices with 3D planimetry, cm2 | 2.87 | 1.63 | 5.76 | 0.83 |
3D ERO, 3-dimensional effective regurgitant orifice; LVEDD, left ventricular end-diastolic diameter; LVEDV, left ventricular end-diastolic volume; LVESD, left ventricular end-systolic diameter; LVESV, left ventricular end-systolic volume; PHT, pressure half-time; SD, standard deviation; SVti/DVti, ratio of systolic velocity-time integral to diastolic velocity-time integral in pulmonary veins; TAPSE, tricuspid annular plane systolic excursion; VTI, velocity-time integral.
The mean preprocedure MVA was 5.46cm2. Of note, a systolic velocity-time integral to diastolic velocity-time integral (SVti/DVti) ratio of<1 (0.59) in the pulmonary veins is a significant prognostic indicator, associated with a particularly poor prognosis for patients undergoing MitraClip implantation.12,13 After the procedure, there was a considerable improvement in SVti/DVti, with the mean value increasing to 1.1 from the previous 0.59 (P<.005). This parameter is important, as a low SVti/DVti ratio after implantation (< 0.72) predicts a recurrence of mitral regurgitation and poor long-term outcome.12–14 In contrast, an improvement in the pulmonary venous flow profile (SVti > DVti) predicts better survival and a lower rehospitalization rate.12
Regarding postclip MVA measurement, the mean MVA obtained by summing orifices using 3D planimetry was 2.87cm2; that is, an approximately 50% reduction compared with the preprocedure value determined by the same method. AVM measurement using PHT yielded a mean of 1.89cm2, with a mean transvalvular gradient of 3mmHg (SD±1.19). The mean temporal resolution of 3D zoom acquisitions was 16 volumes/s (Hz) (range, 12-20Hz). The MVA measured by 3D planimetry showed a better correlation with the mean postclip gradient (y=3.3351 + −0.2176 x, r=0.46, P<.001) than the MVA obtained using PHT (y=2.1937 + −0.08978 x, r=0.19, P=.048) (figure 2). However, as is seen in the figure, there was significant dispersion of the values and the correlation was weak (r=0.46 for 3D planimetry and r=0.19 for PHT). In addition, 3D planimetry demonstrated higher interobserver agreement (intraclass correlation coefficient, 0.90 and coefficient of variation, 9.6%) compared with PHT (intraclass correlation coefficient, 0.81 and coefficient of variation, 19.7%).
DISCUSSIONCurrently, there is no gold standard method for MVA measurement following percutaneous edge-to-edge mitral repair.14,15 While the European and American guidelines of 20095,14 recommended two-dimensional (2D) planimetry and the PHT method for assessing MVA in cases of native mitral valve stenosis, subsequent recommendations in 2011 for echocardiography use in emerging transcatheter interventions did not specify how to assess MVA during percutaneous edge-to-edge mitral valve repair.4,14
Percutaneous mitral repair presents a unique clinical scenario for the following reasons. Within a few heartbeats after clip placement, there is a complete change in left atrial pressure and left ventricular volume.15,16 As the patient is intubated and ventilated, left ventricular afterload decreases, and pulmonary artery oxygen saturation is higher than normal, leading to an overestimation of left ventricular systolic volumes calculated using the Fick principle.14,15,17 Moreover, the procedure involves creating an interatrial communication, which can further complicate systolic volume calculations due to left-to-right shunting.17,18
MVA assessment by echocardiography uses a well-established grading system, validated in various settings.19,20 The PHT method has been validated in rheumatic mitral stenosis and in patients with concurrent mitral stenosis and mitral regurgitation, as it is relatively unaffected by flow.19,21 However, the method has shown considerable limitations in the context of percutaneous mitral valvulotomy.22,23 PHT use also encounters major challenges after mitral clip implantation: changes in ventricular volume and pressure after clip placement; use of mechanical ventilation with decreased afterload; transseptal puncture creating a septal defect required to advance the device, with its subsequent shunting effect on stroke volume; diastolic dysfunction; and changes in left atrial pressure. These complex factors render Gorlin's formula for MVA calculation using the PHT method imprecise in this clinical situation.15–17,22,23 All our patients had a combination of these factors, which limited the accuracy of PHT and may be the reason for general underestimation of MVA by this method. Several studies in similar scenarios, such as immediately after mitral valvuloplasty or surgical repair, have reported that MVA measurement by PHT is prone to errors due to acute changes in loading conditions and valve geometry.18,19
Three-dimensional transesophageal echocardiography holds promise as the method of choice for MVA assessment.20,21,24 Direct planimetry through 3D measurement with summing of orifices is a straightforward approach that is independent of the patient's hemodynamic status.25 Nonetheless, it is not without limitations. It is difficult to use in the catheterization laboratory, requiring advanced operator skills in 3D reconstructions and prolonged processing time. It is subject to errors if the stenotic areas are traced close to the commissures, and the result may be overestimated if the area of each orifice is not calculated separately.14,20 Furthermore, the temporal resolution of 3D zoom acquisitions is lower in patients with atrial fibrillation or a high heart rate, which may have influenced the results of this study. As temporal resolution decreases, the likelihood of missing the moment of greatest valve opening increases, leading to potential underestimation of MVA.14,20 Nonetheless, with the newer systems for 3D acquisition, temporal resolution is higher, and the impact of a high heart rate is less significant than in the past. Despite these inherent limitations of 3D measurement, MVA obtained with this method showed a much stronger correlation with transmitral gradients than the values obtained with PHT; hence, the results are considered conclusive.
As there is no reference test for measuring MVA (and thus, mitral stenosis) after the MitraClip procedure, an indirect approach has been used for stenosis, involving transvalvular gradient determination using continuous Doppler. This method offers the advantage of providing valid measurements for both simple-orifice and double-orifice mitral valves.14,18 Current echocardiography guidelines for percutaneous valve interventions recommend it as a feasible method for estimating the risk of stenosis during the procedure, with the validated cutoff value of ≥ 5mmHg to predict long-term outcomes.25–27
In our retrospective study of patients undergoing edge-to-edge mitral valve repair, we compared 2 noninvasive echocardiographic methods (PHT and 3D planimetry) to measure the MVA immediately after the procedure. Our aim was to determine which technique was more reproducible and correlated better with the postclip mean transvalvular gradient (figure 3). Consistent with previous research, we found that measurements obtained with the PHT method tended to underestimate MVA compared with direct 3D planimetry results.14,26 Furthermore, the planimetry values showed a stronger correlation with transvalvular gradients and lower interobserver variation. These findings suggest that 3D planimetry is a more appropriate method than PHT to assess MVA following edge-to-edge mitral repair.
A recent study by Kagawa et al.28 confirmed the prognostic importance of measuring postclip MVA using transesophageal 3D planimetry in patients with degenerative mitral regurgitation. The study found that those with a postclip MVA < 1.5cm2 had a higher long-term mortality rate. This association was not seen in patients with functional mitral regurgitation, likely because other factors influence their prognosis, such as the presence of cardiomyopathy with reduced systolic function or underlying ischemic heart disease. These findings highlight the importance of accurately measuring MVA after mitral clip implantation. Future research with larger sample sizes is needed to confirm the prognostic significance of reduced MVA in all patient subgroups.
LimitationsOur study has several limitations, including the heterogeneous population undergoing mitral valve repair, small sample size, and the use of various devices. Certain patient-related factors, such as the presence of atrial fibrillation in 55% of the participants, also contribute to the limitations. A major drawback is the lack of a gold standard for comparing the MVA results obtained using PHT and 3D planimetry. Ideally, this reference would be the MVA acquired by pathological anatomy in autopsies of the patients. As this reference is unavailable, we compared the results from each technique with the mean transvalvular gradient determined by Doppler, assuming that the method showing a stronger correlation with this parameter would be superior. Nonetheless, this assumption is not entirely certain, as the mean gradient itself has inherent limitations. Continuous Doppler measurements are influenced by hemodynamic factors such as hemoglobin levels and heart rate. Transmitral gradients could be expected to decrease slightly over time as hemoglobin levels return to normal. Nonetheless, in a study by Herrmann et al.,27 transmitral gradients showed no significant changes during the 24-month follow-up period. In addition, the presence of a residual interatrial communication could affect both the transmitral gradient and PHT results. However, as these measurements were taken with the catheter still in the trans-septal position, we believe that shunting would have a minimal impact. Although significant residual regurgitation can affect gradients, we did not evaluate the influence of residual regurgitation on correlations with the 2 methods. Equally, we did not assess the correlation between volumetric measurements and the derived volume flow rate. Another significant limitation is the absence of a cutoff value for postclip mitral anatomical area that predicts clinically relevant stenosis during follow-up. The cross-sectional nature of the study with no clinical follow-up restricted exploration of this aspect. However, the study by Kagawa et al.28 confirmed the prognostic value of postclip MVA measured by transesophageal 3D planimetry in patients with degenerative mitral regurgitation, showing increased long-term mortality in those with low postclip area (< 1.5cm2).
CONCLUSIONSIn our cohort, the PHT method significantly underestimated postclip MVA and showed higher interobserver variability, compared with direct measurement using transesophageal 3D planimetry. Therefore, 3D planimetry with summation of the individual valvular orifices seems to be a more appropriate method than PHT for MVA assessment following mitral clip placement.
It is important to assess mitral valve stenosis following mitral clip implantation. Significant stenosis can affect the patient's prognosis and hinders further device placement if considerable regurgitation persists after implantation of the first device. PHT, the traditional method for assessing MVA, lacks adequate validation in this clinical scenario. Evidence suggests that 3D planimetry may provide a superior alternative.
WHAT DOES THIS STUDY ADD?The findings of this study suggest that transesophageal 3D planimetry is preferable to the PHT method for assessing mitral stenosis after mitral clip implantation. Therefore, it could be considered the method of choice in routine clinical practice to evaluate procedure outcomes in the catheterization laboratory.
This article received no funding.
ETHICAL CONSIDERATIONSThis article adheres to Helsinki Declaration of the World Medical Association and has received ethics approval from the Hospital Clínico San Carlos de Madrid. The study posed no risk to the patients. As it involved retrospective data, informed consent was not required, and all information obtained was managed with utmost confidentiality by the researchers. No differences according to sex were detected.
STATEMENT ON THE USE OF ARTIFICIAL INTELLIGENCENo artificial intelligence was used in the preparation of this article.
AUTHORS’ CONTRIBUTIONSM. Estrada Ledesma, D. Bastidas Plaza, E. Pozo Osinalde, and J.A. de Agustín contributed to the conception and design, as well as data acquisition, analysis, and interpretation. M. Estrada Ledesma, D. Bastidas Plaza, E. Pozo Osinalde, P. Marcos-Alberca, C. Olmos Blanco, P. Mahía Casado, M. Luaces, J.J. Gómez de Diego, L. Nombela-Franco, P. Jiménez-Quevedo, G. Tirado, L. Collado Yurrita, A. Fernández-Ortiz, J. Villacastín, and J.A. de Agustín have contributed to drafting or critically reviewing the article.
All authors have approved the final version of the article.
CONFLICTS OF INTERESTNone.
