Myocardial dysfunction contributes to early mortality (24-72 hours) among survivors of a cardiac arrest (CA). The benefits of mechanical support in refractory shock should be balanced against the patient's potential for neurological recovery. To date, these early treatment decisions have been taken based on limited information leading mainly to undertreatment. Therefore, there is a need for early, reliable, accessible, and simple tools that offer information on the possibilities of neurological improvement.
MethodsWe collected data from bispectral index (BIS) and suppression ratio (SR) monitoring of adult comatose survivors of CA managed with targeted temperature management (TTM). Neurological status was assessed according to the Cerebral Performance Category (CPC) scale.
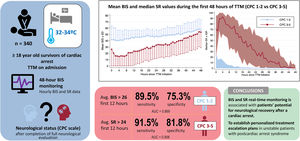
ResultsWe included 340 patients. At the first full neurological evaluation, 211 patients (62.1%) achieved good outcome or CPC 1-2. Mean BIS values were significantly higher and median SR lower in patients with CPC 1-2. An average BIS> 26 during first 12 hours of TTM predicted good outcome with 89.5% sensitivity and 75.8% specificity (AUC of 0.869), while average SR values> 24 during the first 12 hours of TTM predicted poor outcome (CPC 3-5) with 91.5% sensitivity and 81.8% specificity (AUC, 0.906). Hourly BIS and SR values exhibited good predictive performance (AUC> 0.85), as soon as hour 2 for SR and hour 4 for BIS.
ConclusionsBIS/SR are associated with patients’ potential for neurological recovery after CA. This finding could help to create awareness of the possibility of a better outcome in patients who might otherwise be wrongly considered as nonviable and to establish personalized treatment escalation plans.
Keywords
Although extensive efforts have been directed toward improving outcomes in survivors of a cardiac arrest (CA), including increasing community awareness, enhancing the quality and timing of initial resuscitation manoeuvres and the implementation of targeted temperature management (TTM), mortality in patients admitted after successful resuscitation is still very high and is mainly due to severe hypoxic-ischemic encephalopathy.
Another major contributor to low survival rates of CA patients is postcardiac arrest myocardial dysfunction.1–5 This clinical entity has been defined as a transient global dysfunction that starts immediately after CA, peaks 7 to 8hours after recovery of spontaneous circulation (ROSC) and may fully recover in the following 48 to 72hours. When established, it may induce a circulatory collapse that requires prompt recognition and sometimes advanced mechanical support.2,6,7 Consequently, physicians face decisions regarding treatment escalation, which they should balance against the patient's potential for neurological recovery (PNR) with rather scarce information. Thus, based on traditional predictors of survival after CA (initial rhythm, pH, or time to ROSC) as well as physical examination, patients are classified into a category of either good or bad PNR, and many of them are unconsciously denied the possibility of receiving advanced therapies. This is when accessible and reliable tools become relevant, as they could add objective data for individualized treatment escalation plans.
Current guidelines recommend a multimodal approach for neurological prognostication including daily physical exam, biomarkers (neuron-specific enolase, S-100) imaging techniques (computed tomography or magnetic resonance imaging) and neurophysiological tests such as electroencephalogram or somatosensory-evoked potentials. Such a strategy involves a 72-hour delay, as well as other disadvantages, such as limited availability and need for specialized personnel.2,8–10
The bispectral index (BIS) is an easy-to-use, bedside multichannel system that uses electrodes over frontal-temporal regions to record underlying EEG and scalp electromyogram (EMG) signals. Real-time obtained signals are then transformed by a clinically developed proprietary algorithm into an index between 0 (isoelectric EEG) and 100 (full awareness). Another parameter known as the suppression ratio (SR), which estimates the percentage of time of isoelectric or suppressed EEG signal, may also be available on the main display.11,12 The BIS was first used as a method to monitor anesthetic depth,13,14 but due to its accessibility, it has been progressively introduced into the field of postresuscitation. Many studies have established a relationship between BIS monitoring and neurological outcomes in CA patients. However, data on methods, reference cutoff values and proper timing for its assessment are still scarce.15–22
We therefore sought to assess the usefulness of the early performance of BIS and SR to predict patients’ PNR in a population of survivors of CA undergoing TTM. We also aimed to identify the time window when the predictive values of BIS and SR are highest.
METHODSStudy designThis retrospective observational study evaluated all adult (≥ 18 years) comatose survivors of CA admitted consecutively to the acute cardiac care unit (ACCU) of a tertiary care centre between December 2011 and October 2020. The study protocol was conducted according to the principles of the Declaration of Helsinki and was approved by the local Clinical Research Ethics Committee (PI-4756).
Post-resuscitation careFollowing institutional postresuscitation care protocol, TTM started immediately after admission to the ACCU. TTM was performed with ZOLL's Intravascular Temperature Management (IVTM, United States) device, using an endovascular catheter selected according to the patient's size. Temperature measurements were obtained continuously via a bladder probe. Cooling was set at the maximal rate to reach the targeted temperature (32-34oC), which was selected at the discretion of the treating physician or allocated within a randomized clinical trial (NCT01155622 or NCT02035839) and maintained for at least 24hours. Afterwards, controlled rewarming was performed at a set rate of 0.1-0.3oC/h to reach 36.5oC. This temperature was maintained for 72hours after ROSC. All patients were intubated and mechanically ventilated.
On hospital arrival, patients underwent routine initial assessment and treatment. After evaluation of patients’ baseline neurological status, sedation was induced initially by intravenous administration of midazolam (bolus 5-10mg followed by 1.5μg/kg/min infusion) and remifentanil (0.1μg/kg/min). To prevent shivering and minimize EMG interference with BIS values, muscular paralysis was induced by the intravenous administration of cisatracurium (1μg/kg/min). Once the patient was transferred to the ACCU and BIS monitor adequately placed, the above-mentioned drugs were individually and continuously adjusted based on Richmond Agitation Sedation Scale (RASS) and a target BIS index between 40 (deep hypnotic state) and 60 (general anesthesia).
General intensive care management objectives were established according to guideline recommendations and included normoxemia, normocapnia, glycemia <180 mg/dL avoiding hypoglycemia, and mean arterial blood pressure levels of 70 to 100mmHg. Whenever an acute coronary syndrome was suspected to be the underlying cause of the CA, the performance of an early coronary angiography was encouraged.
BIS and SR monitoringBIS was monitored by placing a frontotemporal 4-electrode sensor on the patient's forehead (BIS VISTA monitor Covidien Medtronic, United States) according to the manufacturer's instructions and data registering started at the beginning of TTM. BIS and SR values were noted hourly on nursing charts for at least 48hours. BIS values were assessed by nursing personnel and had to fulfil pre-established quality criteria of low EMG artifacts (absent or <30dB) and signal quality indicator> 80. Patients without BIS monitoring or without BIS data meeting those quality criteria were excluded from the analysis.
Neurological assessmentNeurological outcome was graded according to the Cerebral Performance Category (CPC) scale, from 1 (good cerebral performance) to 5 (brain death). CPC categories were dichotomized into good (CPC 1-2) or poor (CPC 3-5) outcome. The CPC score recorded after completing the first comprehensive neurological evaluation (including clinical examination, biomarkers, imaging, and functional techniques) was chosen as the primary outcome of this study. Moreover, the CPC score was again registered at the end of the pre-established 3-month follow-up period.
In addition, we would like to emphasize that decisions of withdrawal of life-sustaining therapies (WLST) were made according to current guideline recommendations following a multimodal approach. Neither determination of the patient's final neurological status nor decisions on WLST were made by using BIS values, as BIS monitoring was only employed for sedative drug titration purposes.
Data collection and statistical analysisWe prospectively collected data on patients’ baseline demographics and comorbidities, CA characteristics (Utstein-Style), laboratory findings, specific interventions, complications as well as survival at discharge, and outpatient follow-up.
Continuous variables are presented as means with their standard deviations (SD) and were compared with the use of the Student t test; variables that were not normally distributed are described as medians and interquartile ranges, and differences were analyzed with the Kruskal-Wallis method. Categorical variables were compared by the chi-square or Fisher exact tests. Predictive models were estimated with logistic regression. Internal validation of all models was performed using the bootstrap procedure. Receiver-operator characteristic (ROC) curves were plotted and, to measure usefulness of BIS and SR for prediction of neurological outcomes, the area under the curve (AUC) was determined using hourly and average consecutive 6-, 12- and 24-hour BIS and SR values. Optimal cutoff points of BIS values to predict good outcome (CPC 1-2) and SR values to predict bad neurological outcome (CPC 3-5) were calculated using the maximum value of the Youden index (sensitivity + specificity −1). A P value <.05 was considered statistically significant. All analyses were conducted using Stata Statistical Software release 15 (StataCorp. 2017, United States).
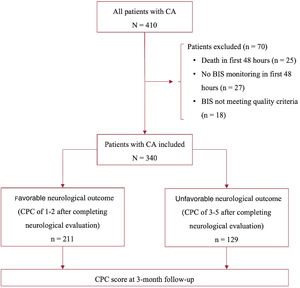
RESULTSDuring the study period, 410 CA patients were admitted to our unit and underwent TTM. A total of 70 patients were excluded from the analysis: 28 because of a lack of BIS monitoring, 17 because BIS values did not meet prespecified quality criteria, and 25 due to death occurring within first 48hours of hospital admission with unknown neurological status (figure 1). The mean BIS values and causes of death of these 25 patients are displayed in . Therefore, 340 patients were included in our analysis, 72 (21.2%) were females and their mean age was 61.7±14.3 years.

After completing the first comprehensive neurological evaluation (including clinical examination, biomarkers, imaging and functional techniques), 211 patients (62.1%) had a CPC score of 1-2 and 129 (37.9%) a CPC score of 3-5. Comparison between groups of both baseline and CA characteristics are shown in table 1. Factors associated with a good neurological outcome (CPC 1-2) included: initial shockable rhythm (86.7% vs 48.1%, P <.001), witnessed CA (97.6% vs 86.8%, P <.001), lower levels of serum lactate (5.3 vs 7.6 mmol/L, P <.001) and higher levels of pH (pH of 7.21 vs 7.14, P <.001) both at admission. Changes in CPC score during the 3-month follow-up are shown in .
Demographics, baseline and cardiac arrest-related variables of all patients included in the study and differences between the PC 1-2 and CPC 3-5 groups
| Variable | All patients (n=340) | CPC 1-2 (n=211) | CPC 3-5 (n=129) | 5p |
|---|---|---|---|---|
| Age, y | 61.7±14.3 | 60.8±14.8 | 63.3±13.4 | 0.12 |
| Sex | ||||
| Male | 268 (78.8%) | 174 (82.5%) | 94 (72.9%) | 0.036* |
| Female | 72 (21.2%) | 37 (17.5%) | 35 (27.1%) | |
| Hypertension | 169 (49.7%) | 96 (45.5%) | 73 (56.6%) | 0.06 |
| Diabetes | 90 (26.5%) | 42 (19.9%) | 48 (37.2%) | <0.001* |
| Dyslipidemia | 145 (42.7%) | 93 (44.1%) | 52 (40.3%) | 0.50 |
| Tobacco use | 127 (37.4%) | 83 (39.3%) | 44 (34.1%) | 0.33 |
| Previous MI | 76 (22.4%) | 46 (21.8%) | 30 (23.3%) | 0.76 |
| OHCA | 298 (87.7%) | 179 (84.8%) | 119 (92.3%) | 0.08 |
| Witnessed CA | 317 (93.2%) | 205 (97.6%) | 112 (86.8%) | <0.001* |
| Bystander CPR | 254 (74.7%) | 151 (73.0%) | 103 (81.1%) | 0.09 |
| Initial rhythm | ||||
| Shockable | 245 (72.1%) | 183 (86.7%) | 62 (48.1%) | <0.001* |
| Nonshockable | 95 (27.9%) | 28 (13.3%) | 67 (51.9%) | |
| No-flow time, min | 2.0 [1.0–5.0] | 1.0 [0.0–4.0] | 5.0 [1.0–10.0] | <0.001* |
| Low-flow time, min | 5.0 [0.0–10.0] | 5.0 [0.0–10.0] | 5.0 [0.0–10.0] | 0.97 |
| Time to ROSC, min | 23.0 [15.0–33.0] | 20.0 [12.0–30.0] | 28.0 [20.5–40.0] | <0.001* |
| pH on admission | 7.18±0.16 | 7.21±0.15 | 7.14±0.16 | <0.001* |
| Lactate on admission, mmol/L | 6.2±4.0 | 5.3±3.6 | 7.6±4.2 | <0.001* |
| Glycemia on admission, mg/dL | 250.9±100.5 | 231.5±98.8 | 282.2±95.4 | <0.001* |
CA, cardiac arrest; CPC, cerebral performance category; CPR, cardiopulmonary resuscitation; MI, myocardial infarction; OHCA, out-of-hospital cardiac arrest; ROSC, recovery of spontaneous circulation.
Data are expressed as No. (%), mean±standard deviation or median [interquartile range].
Beyond first 48hours and within the 3-month follow-up period, 135 patients (39.7%) died and the leading cause of death was WLST due to severe hypoxic-ischemic encephalopathy (80 patients, 59.3%). Other causes of death are described in table 2.
Main causes of death in survivors of cardiac arrest beyond the first 48hours of admission and within the 3-month follow-up
| WLST due to poor neurological prognostication | 80 (59.3) |
| Cardiovascular | 20 (14.8) |
| WLST due to other conditions | 14 (10.4) |
| Brain death | 12 (8.9) |
| Infection | 5 (3.7) |
| Respiratory | 3 (2.2) |
| Hemorrhagic | 1 (0.7) |
WLST, withdrawal of life-sustaining therapies.
The data are expressed as No. (%).
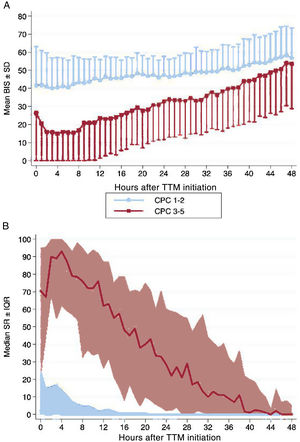
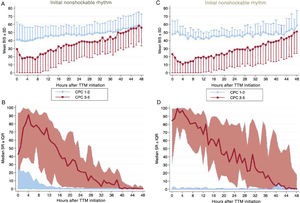
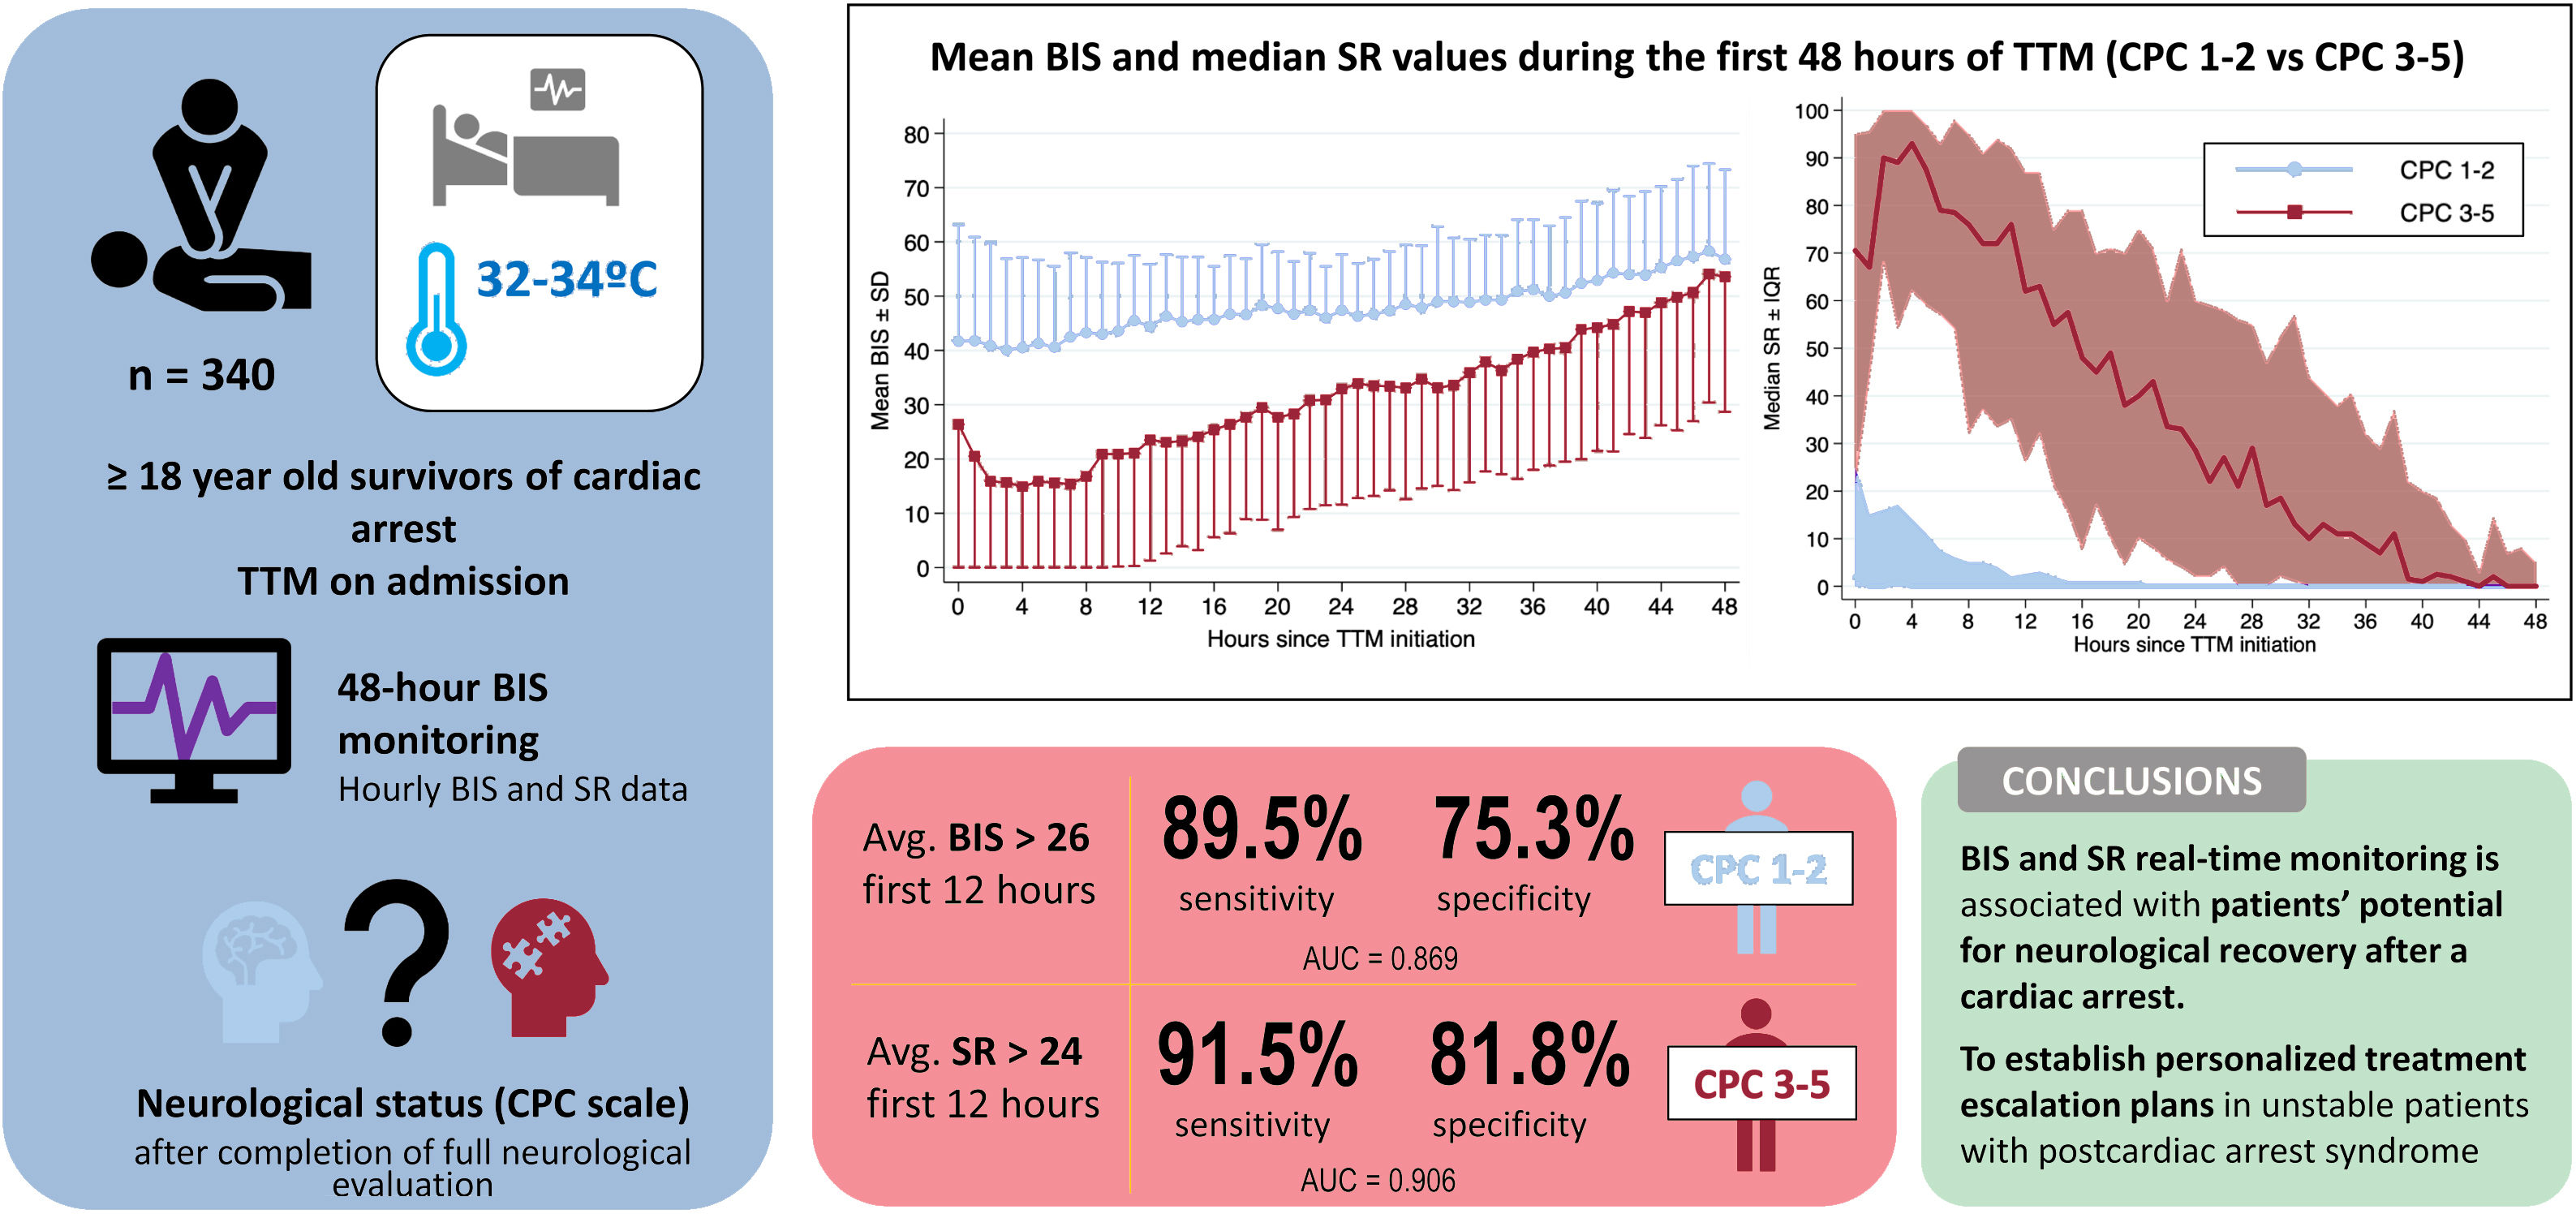
Hourly BIS and SR data for every hour during first 48hours of TTM are illustrated in figure 2 according to patients’ neurological outcome. Average BIS and SR values during first 48hours of TTM demonstrated differences between the CPC 1-2 and CPC 3-5 groups, also after controlling potential confounders with a multivariable analysis (table 3). In patients with good neurological outcome, the mean BIS values were consistently higher, while median SR values were significantly lower. The differences found for both BIS and SR values were more pronounced during first 12 to 24hours of monitoring. When we analyzed the sample according to the initial rhythm of the CA, differences remained significant and were higher in patients with initial nonshockable rhythms (figure 3).
 mean BIS and (B) median SR values during the first 48hours of targeted temperature management in survivors of cardiac arrest according to their neurological outcome (CPC 1-2 vs CPC 3-5). BIS, bispectral index; CPC, cerebral performance category; IQR, interquartile range; SD, standard deviation; SR, suppression ratio; TTM, targeted temperature management. For illustrative purposes, we have omitted the −SD interval in the CPC 1-2 group and the + SD interval in the CPC 3-5 group in graph A.")
Changes in (A) mean BIS and (B) median SR values during the first 48hours of targeted temperature management in survivors of cardiac arrest according to their neurological outcome (CPC 1-2 vs CPC 3-5). BIS, bispectral index; CPC, cerebral performance category; IQR, interquartile range; SD, standard deviation; SR, suppression ratio; TTM, targeted temperature management. For illustrative purposes, we have omitted the −SD interval in the CPC 1-2 group and the + SD interval in the CPC 3-5 group in graph A.
Outcomes of average BIS and SR values during first 48hours of targeted temperature management after cardiac arrest according to neurological function
| Variable | CPC 1-2 | CPC 3-5 | OR (95%CI) | P | Adj. OR* (95%CI) | P* |
|---|---|---|---|---|---|---|
| Av. BIS | 47.9±7.1 | 31.5±14.5 | 1.17 (1.13-1.21) | <.001 | 1.14 (1.09-1.19) | <.001 |
| Av. SR | 3.7±6.0 | 39.6±24.9 | 0.85 (0.81-0.89) | <.001 | 0.85 (0.80-0.91) | <.001 |
Adj., adjusted; Av., average; BIS, bispectral index; CI, confidence interval; CPC, cerebral performance category scale; SR, suppression ratio.
The data are expressed as mean±standard deviation.
Adjusted OR and its p value obtained by multivariable logistic regression model, including all potential confounders (those variables which were different in the single-variable comparison: sex, diabetes mellitus, witnessed cardiac arrest, initial rhythm, no-flow time, time to recovery of spontaneous circulation, pH on admission, lactate on admission, and glycemia on admission).
. Patients with an initial shockable rhythm are displayed on the left (A, B) and those with initial nonshockable rhythm, on the right (C,D). BIS, bispectral index; CPC, Cerebral Performance Category; IQR, interquartile range; SD, standard deviation; SR, suppression ratio; TTM, targeted temperature management. For illustrative purposes, we have omitted the −SD interval in the CPC 1-2 group and the +SD interval in the CPC 3-5 group in graphics A and C.")
Differences related to the initial rhythm of cardiac arrest in changes in mean BIS and median SR values during the first 48hours of targeted temperature management in survivors of cardiac arrest according to their neurological outcome (CPC 1-2 vs CPC 3-5). Patients with an initial shockable rhythm are displayed on the left (A, B) and those with initial nonshockable rhythm, on the right (C,D). BIS, bispectral index; CPC, Cerebral Performance Category; IQR, interquartile range; SD, standard deviation; SR, suppression ratio; TTM, targeted temperature management. For illustrative purposes, we have omitted the −SD interval in the CPC 1-2 group and the +SD interval in the CPC 3-5 group in graphics A and C.
Furthermore, 5 patients who exhibited a BIS value of zero at hour 1 survived with a CPC of 1-2 and only 1 from hour 2 to 6. An average BIS <10 for first 6hours of TTM was registered in 10 patients who recovered with favorable neurological outcome (13.5%), while only 3 did so with an average BIS <10 for the first 12hours (5.8%). Likewise, an average SR> 90 for first 6hours was found in only 2 patients who survived without neurological impairment (9.7%), and no patient finally had with a CPC 1-2 when an average SR> 90 was obtained during the first 12hours.
ROC analysis and the hourly AUC of mean BIS and median SR values to predict neurological outcome are available in . The AUC for BIS prediction of good neurological outcome was ≥ 0.85 at hour 4 and from hour 6 to hour 8 of TTM. The highest AUC was observed at hour 7 of TTM (0.878). Moreover, to predict a poor neurological outcome (CPC 3-5), median SR from hour 2 to hour 26 of TTM exhibited an AUC ≥ 0.85, with hour 18 being the optimal time point for unfavorable neurological prediction (AUC of 0.920).
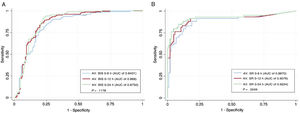
The prediction performance of average BIS values during the first 6, 12 and 24hours of TTM are shown in table 4. ROC curves were plotted () and are compared in figure 4A. A cutoff value of BIS> 26 during first 12hours of TTM predicted a good neurological outcome with 89.5% sensitivity and 75.3% specificity, resulting in a false negative ratio of 10.5% (AUC of 0.869 with a 95%CI of 0.828-0.903) (figure 5).
Predictive performance of average BIS and SR during the first 6, 12 and 24hours of TTM for neurological prognostication
| Cutoff | AUC (95%CI) | Se | Sp | PPV | NPV | |
|---|---|---|---|---|---|---|
| Performance of average BIS to predict good neurological outcome (CPC 1-2) | ||||||
| 0-6 h of TTM | > 21 | 0.843 (0.799-0.881) | 90.3 | 69.8 | 83.0 | 81.5 |
| 0-12 h of TTM | > 26 | 0.869 (0.828-0.903) | 89.5 | 75.3 | 85.8 | 81.5 |
| 0-24 h of TTM | > 32 | 0.876 (0.837-0.909) | 92.9 | 76.7 | 86.7 | 86.8 |
| Performance of average SR to predict poor neurological outcome (CPC 3-5) | ||||||
| 0-6 h of TTM | > 33 | 0.887 (0.828-0.931) | 88.1 | 81.1 | 72.2 | 92.5 |
| 0-12 h of TTM | > 24 | 0.906 (0.852-0.946) | 91.5 | 81.8 | 73.0 | 94.7 |
| 0-24 h of TTM | > 25 | 0.923 (0.872-0.958) | 85.0 | 91.9 | 85.0 | 91.9 |
AUC, area under the curve obtained by receiver-operator characteristic (ROC) curve analysis; BIS, bispectral index; CPC, cerebral performance category; NPV, negative predictive value; PPV, positive predictive value; Se, sensitivity; Sp, specificity; SR, suppression ratio; TTM, targeted temperature management.
 curves of all predictive models using average BIS values during the first 6, 12 and 24hours of TTM (A) and average SR values during the first 6, 12 and 24hours of TTM (B). Avg, average; AUC, area under the ROC curve; BIS, bispectral index; SR, suppression ratio; TTM, targeted temperature management.")
Comparison of receiver-operator characteristic (ROC) curves of all predictive models using average BIS values during the first 6, 12 and 24hours of TTM (A) and average SR values during the first 6, 12 and 24hours of TTM (B). Avg, average; AUC, area under the ROC curve; BIS, bispectral index; SR, suppression ratio; TTM, targeted temperature management.

Central Illustration. BIS an SR values during the first hours of TTM can accurately predict patients’ potential for neurological recovery in survivors of a cardiac arrest. The predictive performance of their average values during the first 12hours are illustrated. AUC, area under the curve; Avg, average; BIS, bispectral index; CPC, Cerebral Performance Category scale; SR, suppression ratio; TTM, targeted temperature management.
The prediction performance of average SR values during the first 6, 12 and 24hours of TTM is available in table 4. ROC curves are plotted () and compared in figure 4B. A cutoff value of SR> 24 during the first 12hours of TTM could predict a poor outcome with 91.5% sensitivity and 81.8% specificity (AUC of 0.906 with a 95%CI of 0.852-0.946) (figure 5). Only 9 patients with an average SR> 24 survived with favorable neurological outcome (CPC 1-2), resulting in a negative predictive value of 94.7%. The main statistical outcomes, calibration parameters and internal validation with bootstrapping techniques of all logistic regression models are summarized in .
Finally, shows how by including average BIS and SR values during the first 6, 12 and 24hours in addition to other classic variables, which are widely used for early stratification of patients in daily practice (age, witnessed CA, bystander PCR, initial rhythm, no-flow time, time to ROSC, glycemia, pH and serum lactate on admission), the predictive performance for favorable neurological outcome increased (AUC 0.947 vs 0.829; AUC 0.961 vs 0.833; AUC 0.966 vs 0.835 for 6-, 12- and 24-hours BIS/SR values respectively; P <.001 for all ROC curves comparisons).
DISCUSSIONTo our knowledge, this is the largest observational study of CA patients undergoing TTM that confirms the ability of the EEG-derived parameters BIS and SR to identify patient's PNR early in the course of care (figure 5).
Many CA patients will develop hemodynamic instability during the first hours after hospital admission, mainly due to postarrest myocardial dysfunction that may worsen if the arrest is of cardiac origin (eg, acute coronary syndrome, previous cardiomyopathy). Although this clinical entity has the potential for full recovery and most patients will respond to inotropes and/or vasopressors, some will progress to a state of refractory shock requiring advanced mechanical support to avoid fatal outcomes. Consequently, physicians face the decision of whether or not to scale up treatments early in the course of care with rather scarce information on the patient's neurological status. Within this timeframe, specific tools that aid prediction of neurological outcome have not yet been validated and this lack of knowledge has unfortunately closed the door to advanced therapies in many patients.
These are just some of the reasons why noninvasive BIS monitoring has generated a growing interest in the field of postresuscitation care.23 After a brief structured education, staff are capable of interpreting both simplified EEG traces and values displayed on the monitor.11,12 Moreover, in the past few years evidence has emerged supporting the association of BIS with neurological outcomes in CA patients undergoing TTM.24–31 Nevertheless, it must be asked why this tool has not been included in multimodal neurological prognostication algorithms.32
One of the main concerns is the reliability of BIS monitoring. In this study, having an average BIS value> 26 during the first 12hours of TTM predicted good neurological outcome with 89.5% sensitivity and 75.3% specificity, while an average SR value> 24 during the first 12hours of TTM predicted poor neurological outcome with 91.5% sensitivity and 81.8% specificity. Indeed, the first 6 to 24hours were the time points in which both BIS and SR values reached their highest predictive rates (AUC> 0.80). To put some perspective on the magnitude of these findings, the absence of the bilateral N20 component of the somatosensory-evoked potentials with median nerve stimulation, considered one of the most reliable tests for neurological prognostication in the setting of postresuscitation care, predicts poor outcome with 83% sensitivity and 79% specificity during hours 8 to 24 after ROSC in patients with body temperature> 35°C27,33,34. A further example is found in laboratory data, as delta neuron-specific enolase values between 72hours after ROSC and hospital admission can predict poor neurological outcome with an AUC of 0.90.35
Another possible argument for not including BIS monitoring in multimodal neurological prognostication algorithms is that it may carry a potential risk of early WLST (< 72hours postarrest).36 Naturally, with our findings we do not mean to encourage early WLST, as we have learned from previously published data that late awakening may occur in up to 20.9% of CA patients, especially when treated with lower targeted temperatures.37 In addition, in this study we found that up to 13.5% of patients who exhibited low BIS values during the first hours of admission finally had a CPC score of 1-2. Undoubtedly, the multimodal approach recommended by the guidelines is the path to follow for neurological prognostication; however, we believe that BIS monitoring could strengthen currently applied general prediction models. Take, for example, the results of one of the variables included in general prediction models, initial pH: low initial pH levels (< 7.2) have usually been related to poor neurological prognosis after CA, yet recent evidence has suggested that even with extremely low initial pH levels (< 7.0), 20% of patients recover with a good neurological outcome.38 Indeed, this study shows that when BIS and SR values are added to classic variables used for stratification at admission (witnessed CA, initial rhythm, time to ROSC, pH, and serum lactate on admission), the predictive performance of neurological outcome increases significantly, and it could prevent undertreatment of patients specially in the first 24 to 48hours of hospital admission.39–43
Moreover, as CA patients might suddenly become unstable, we present data that supports the fact that hourly BIS and SR values exhibit an overall good predictive performance starting as early as hour 2 for SR and hour 4 for BIS, which is sustained over first 24 to 48hours of TTM. In addition, we propose different cutoff points of average BIS and SR values during the first 6, 12 and 24hours of TTM, all of them showing high predictive power (table 3, figure 4). This finding reinforces the dynamic nature of these EEG-derived parameters and differs from most previous studies which have focused on finding an optimal cutoff point of BIS and, less frequently, SR values in a particular timeframe (eg, at minute 267 or at hour 4).24,26
Finally, this study has several limitations. Although it has a comparably large population in contrast to previous publications, it was performed at a single center with established comprehensive postresuscitation care, and it is observational in nature. Another limitation is that we did not analyze the possible influence on BIS/SR values of the total dose of sedatives agents administered to each patient. Nevertheless, we believe that BIS/SR values could be either under- or overestimated, mainly during the first 2 to 3hours after hospital admission since, after completing the assessment of patients’ baseline neurological status and before arriving at the ACCU, all were sedated according to the standard doses pre-established in our local protocol. Once the BIS monitor was placed, sedative agents were individually titrated for a BIS value of 40 to 60. Therefore, variability in the total doses of individual sedatives prevent us from drawing conclusions about them. The fact that all our patients received continuous intravenous muscular relaxing agents may be perceived as another limitation, but it helped to ensure proper and quality readings of BIS monitoring. Moreover, patients who died within the first 48hours of hospital admission were excluded from the analysis, which may constitute a bias as we could not complete thorough neurological evaluation. Finally, the accuracy of the data relies on pre-existing documentation, which may be either incomplete or incorrect at the moment of collection.
CONCLUSIONSPending further prospective research, BIS and SR monitoring in survivors of a CA undergoing TTM offer accurate, real-time, bedside information for the early prediction of patients’ PNR. Furthermore, this finding could help to create awareness of the possibility of giving a better chance to patients who might otherwise be wrongly considered as nonviable and to establish personaliz ed treatment escalation plans.
FUNDINGNone.
AUTHORS’ CONTRIBUTIONSE. Arbas-Redondo and S.O. Rosillo-Rodríguez contributed equally to this article (study design, data collection, statistical analysis, drafting, and revision of the manuscript). E. López-de-Sa contributed to the study design, statistical analysis, and revision of the manuscript. E. Armada-Romero contributed to the study design and revision of the manuscript. C. Merino-Argos, I. Marco-Clement, L. Rodríguez-Sotelo, L.A. Martínez-Marín, L. Martín-Polo, and A. Vélez-Salas contributed to the data collection. J. Caro-Codón and D. García-Arribas contributed to the data collection and statistical analysis. All authors have read and approved the final version of the manuscript submitted to this journal.
CONFLICTS OF INTERESTThe authors declare that they have no conflict of interest.
- •
BIS and SR values have shown a correlation with neurological outcomes in previous observational studies of comatose survivors of a CA. Nevertheless, these studies are heterogeneous in methodology and most of them refer to the ability of BIS/SR to predict neurological outcomes at specific time points, whereas both these values and patients’ clinical course are dynamic.
- •
BIS and SR values during the first 24hours of TTM can accurately predict patients’ PNR. Predictive rates are consistently high during a wide range of hours after TTM initiation (some of them reaching 100% specificity for poor prognostication), allowing their interpretation to be free from time restrictions in the first 12 to 24hours. This is relevant as myocardial dysfunction usually peaks in first 8 to 24hours. Therefore, BIS/SR could become a noninvasive tool that eases physicians in their hard decision-making process about treatment escalation, potentially avoiding undertreatment.
Supplementary data associated with this article can be found in the online version available at https://doi.org/10.1016/j.rec.2022.03.004