
The aims of this study were to determine the dose-response association of carotid arterial stiffness with vascular outcomes and overall mortality, and to assess their added predictive capacity.
MethodsPopulation-based cohort study including 6468 individuals, with a median follow-up of 6.5 years. Six carotid artery stiffness indices were assessed: strain, stiffness, Peterson elasticity coefficient, compliance coefficient, distensibility coefficient, and pulse wave velocity (PWV). Incident coronary, cerebrovascular, global vascular, and total fatal events were identified.
ResultsCarotid compliance and distensibility coefficients were not associated with any of the outcomes. Carotid stiffness, Peterson elasticity coefficient, and PWV showed a direct linear relationship to cerebrovascular disease: the risk increased by 8% (95%CI, 1-16) per stiffness unit increase, by 7% (95%CI, 2-13) per 10-unit Peterson elasticity coefficient increase, and by 26% (95%CI, 8-48) per PWV unit increase. Carotid strain showed a nonlinear association with ischemic heart disease. When strain was ≤ 0.09 units, each 0.01-unit increase was associated with a 15% lower risk of coronary events (95%CI,−33 to 6); above 0.09 units, each 0.01 increase in strain was associated with a 16% higher risk of coronary events (95%CI, 6-27). The addition of the stiffness indices did not improve the predictive capacity of validated risk functions.
ConclusionsCarotid stiffness, Peterson elasticity coefficient, and PWV have a direct linear association with cerebrovascular disease risk. Carotid strain is not linearly related to U-shaped ischemic heart disease risk. The inclusion of these indexes does not improve the predictive capacity of risk functions.
Keywords
Ischemic heart disease (IHD) and stroke remain the leading causes of the global burden of disease in the population older than 49 years.1 Arterial stiffness has been proposed as a noninvasive imaging method to assess arterial wall damage and vascular aging, as well as a predictive biomarker of vascular risk. Although current guidelines do not recommend its use due to measurement difficulties,2,3 a meta-analysis including 10 studies (n=22 472 individuals) showed that carotid arterial stiffness predicts cardiovascular and overall mortality and future cerebrovascular events and improves the predictive capacity of classic risk functions.4
Arterial stiffness can be estimated by measuring regional or local stiffness and several indices are available.3 The most popular index for calculating regional arterial stiffness is pulse wave velocity (PWV), generally the carotid-femoral PWV to estimate aortic stiffness. Local arterial stiffness can be quantified by indices based on changes in arterial diameters and their relationship to changes in arterial blood pressure.5 The linear and nonlinear pattern of the association of these indices with vascular outcomes and mortality has not been properly analyzed to date.
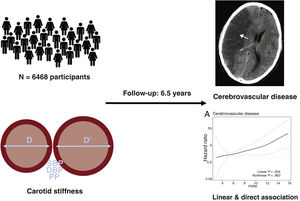
The aim of this analysis was to determine the dose-response association of several measurements of local carotid arterial stiffness with vascular outcomes and overall mortality in a population cohort in a region with a low incidence of cardiovascular disease (figure 1). We also assessed the added predictive capacity value of carotid arterial stiffness indices for those outcomes.
METHODSDesign and population
The Registre Gironí del Cor (REGICOR) study involves a prospective population-based cohort in Girona.6 Individuals living in the city of Girona and other cities and rural villages of Girona province were randomly selected from the census and invited to participate in 3 different surveys (participation rate >70.0%): 1748 individuals aged 25 to 74 years from 1994 to 1996; 3058 aged 25 to 74 years from 1999 to 2001; and 6352 aged 35 to 79 years from 2003 to 2006. All these participants were invited to attend a second visit between 2007 and 2013 in which carotid ultrasound was performed and were then followed up until December 31, 2016. The present analysis included all participants of the 3 surveys without a personal history of coronary or cerebrovascular disease who were not institutionalized, were living in the monitored area, and were attending the second visit with completion of carotid stiffness measurements.
All included participants were duly informed about the study and signed a written consent form. The study was approved by the local ethics committee.
Carotid artery stiffness measurementsAs previously described,7 carotid scans were assessed by 3 certified sonographers using a standardized protocol and an Acuson XP128 ultrasound instrument (Acuson-Siemens, Germany) equipped with an L7 5-12MHz linear array transducer. The scans were conducted at a specific site within each city or village, generally at a primary care center. Inter- and intrasonographer variability were evaluated in 42 participants, using repeated intima-media thickness (IMT) measurements obtained at 2 visits 2 weeks apart. The intraclass correlation coefficients for the mean IMT of the common carotid artery (CCA) were> 0.82 for both inter- and intrasonographer variability; the correlation and the mean difference between the M-mode right and left mean CCA diameter was 0.73 and 0.10, respectively.
During the carotid ultrasound scan, the anterior and posterior walls of the distal right and left CCA were visualized in B-mode. To obtain the M-mode anterior wall intima-lumen and posterior wall lumen-intima tracings, the sonographer switched from the full B-mode to a 1/3 B-mode 2/3 M-mode image of the distal CCA. The 1/3 B-mode image guides the M-mode. The movements of the arterial walls on the 2/3 M-mode image shows waveforms with the double-line patterns of the arterial walls over time. Bilaterally, images were saved as a DICOM (digital information and communication in medicine) stills. These still images were analyzed offline using validated “eTrack” software in 2 imaging laboratories Imagelabonline & Cardiovascular, The Netherlands, n=3182 images; and Instituto de Ciencias del Corazón (ICICOR/ICICORELAB), Spain, n=3286 images), applying the same processing protocol and software.8 The eTrack software traces the waveforms of the leading edges of anterior wall intima-lumen and posterior wall lumen-intima interfaces. If the contours of both walls are identified for at least 2 heartbeats, the software can calculate lumen diameter changes and calculate parameters and heart rates according to international recommendations.9 Systolic and diastolic blood pressure were determined twice after a 5minute rest; the mean value was calculated before performing the study and considered for further calculations.
Several local carotid arterial stiffness indices were calculated in the right and the left CCA:


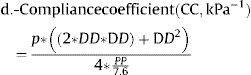
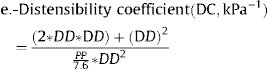
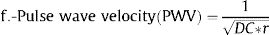
Where: ΔD is the increment of the CCA diameter in systole (diameter in systole – diameter in diastole), DD is the diastolic CCA diameter, SBP is the systolic blood pressure, DBP is the diastolic blood pressure, PP is the pulse pressure (SBP-DBP), and ρ is blood density, assumed as 1.050kg/m3.
Some of these indices (β, Ep, PWV) are directly related to stiffness, whereas others (strain, CC, DC) are inversely related to stiffness. For each participant, right and left M-mode carotid values for each of the stiffness indices were averaged.5 If M-mode data of a given one site were missing, we used data of the available site only.
Follow-up and outcomesWe used several data sources to identify the clinical outcomes of interest in the follow-up of the participants: physical re-exams, telephone contact, medical records review, and linkage with the program of analytical data for research and innovation in health (PADRIS) of the Government of Catalonia, which includes all hospital admissions, primary care diagnosis, and the official mortality register. At the time of data collection, the follow-up was updated December to 31, 2016. For participants who relocated outside Catalonia, the follow-up date was censored at the time of change of residence.
Four main outcomes were defined: a) IHD events, including fatal and nonfatal myocardial infarction or angina (ICD9 codes 410-414 or ICD10 codes I20-I25 in the medical or mortality records); b) cerebrovascular events, including fatal and nonfatal stroke (ICD9 codes 431-437 or ICD10 codes I69.1-I69.9, in the medical or mortality records); c) overall vascular disease events, including fatal and nonfatal IHD and cerebrovascular events, and other fatal vascular conditions (ICD9 codes 390-459 and 798 or ICD10 codes I00-I99 in the mortality register); and d) all-cause mortality. All the events were classified by an event committee according to standardized criteria. This committee consisted of 3 investigators from the study who were blinded to any relevant exposures of interest. If there were multiple events in the same participant, the first occurring event was considered in defining the composite global vascular outcome.
Other covariatesA group of trained nurses and interviewers used standardized and validated questionnaires and measurement methods to collect other variables of interest.10 Tobacco consumption and educational level were self-reported on standard questionnaires. Hypertension was considered when previously diagnosed by a physician, was under treatment, or showed values of SBP ≥ 140mmHg or DBP ≥ 90mmHg. Fasting blood samples were collected and total cholesterol, high-density lipoprotein cholesterol, triglycerides, and glucose concentrations were determined. Low-density lipoprotein cholesterol levels were estimated using the Friedewald equation when triglycerides were <300mg/dL. Diabetes was defined if previously diagnosed, was under treatment, or showed fasting glucose values ≥ 126mg/dL. Previous vascular events were self-reported and validated by hospital and ambulatory-clinic records.
Statistical analysisCategorical data are expressed as counts and percentages. Continuous variables are expressed as mean (standard deviation) or median [interquartile range]. The student t-test or nonparametric Mann-Whitney test were used to identify differences in continuous traits between groups. The chi-square test was used to assess differences in categorical variables between groups. The bivariate association between continuous variables was assessed with the Spearman correlation coefficient.
To explore the linear and nonlinear dose-response pattern of the relationship between carotid stiffness indices and vascular outcomes or all-cause mortality, we used Cox or Fine-Gray (considering competing risk for events) regression models with penalized spline smoothing for each stiffness variable of interest. Noncardiovascular mortality was considered a competing event for cardiovascular events, noncoronary mortality a competing event for coronary events, and noncerebrovascular mortality a competing event for cerebrovascular events. When the relationship included a significant nonlinear component (P <.05), we used morphological curve analysis to define the best knot at which a change in the linear dose-response was observed. The analyses were then segmented according to this knot and Cox or Fine-Gray regression modeling considered the stiffness index of interest as a continuous variable in each of the defined segments, assuming a linear risk in each of the segments. All the models were fully adjusted a priori for age, sex, classic cardiovascular risk factors (body mass index, smoking, diabetes, SBP, diastolic blood pressure, low-density lipoprotein cholesterol, high-density lipoprotein cholesterol and triglycerides), and diabetes, hypertension, and dyslipidemia treatments.
The added predictive value of carotid stiffness indices was assessed by analyzing improvement in discrimination (area under the ROC curve [AUC]) and in categorical net reclassification index (NRI), considering 5% and 10% as a cutoff points, when each was included in validated and specific IHD (REGICOR)11 and cerebrovascular (FRESCO)12 risk functions.
All statistical tests were based on 2-tailed hypothesis testing and P values below 0.05 were considered statistically significant. Statistical analysis was performed with R version 4.1.2, and pspline function, survival, cmprsk and mstate R packages were also used.
For sensitivity analysis, the potential role of the laboratory where the images were analyzed was explored in 3 ways: a) including the interaction between the laboratory and the stiffness variable in the multivariate model; b) stratifying the analysis by laboratory; and c) including the laboratory as a covariate in the multivariate model.
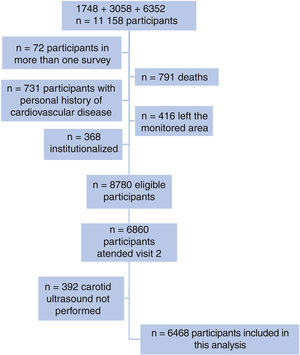
RESULTSThe flow chart of the individuals finally included in the analysis is shown in figure 2 (n=6468; 73.67% of the originally eligible participants included). No clinically significant differences between those included (n=6468) and not included (n=2312) were observed (table 1 of the supplementary data).

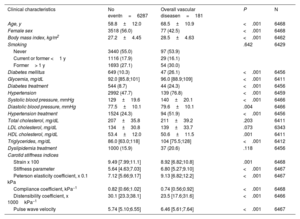
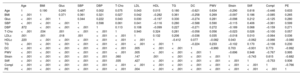
The median follow-up was 6.5 years, and 97, 85, 181 and 311 IHD, cerebrovascular, overall vascular, and fatal events, respectively, were observed. These events represent a cumulative incidence rate of 1.50%, 1.31%, 2.80%, and 4.81%, respectively, during the follow-up. The characteristics of the participants included in the study, stratified by the incidence of overall vascular disease, are shown in table 1. Participants with overall vascular disease were older, with a higher proportion of men and higher prevalence of vascular risk factors. They also presented with higher levels of stiffness, Peterson's elasticity coefficient, and PWV and lower strain, compliance, and distensibility coefficients. Participant characteristics stratified by the presence of IHD, cerebrovascular disease, and overall mortality are shown in tables 2 to 4 of the supplementary data. The correlation between carotid stiffness indices and vascular risk factors is shown in table 2.
Clinical characteristics and carotid stiffness values in participants without and with a vascular event during follow-up
| Clinical characteristics | No eventn=6287 | Overall vascular diseasen=181 | P | N |
|---|---|---|---|---|
| Age, y | 58.8±12.0 | 68.5±10.9 | <.001 | 6468 |
| Female sex | 3518 (56.0) | 77 (42.5) | <.001 | 6468 |
| Body mass index, kg/m2 | 27.2±4.45 | 28.5±4.63 | <.001 | 6462 |
| Smoking | .642 | 6429 | ||
| Never | 3440 (55.0) | 97 (53.9) | ||
| Current or former <1 y | 1116 (17.9) | 29 (16.1) | ||
| Former> 1 y | 1693 (27.1) | 54 (30.0) | ||
| Diabetes mellitus | 649 (10.3) | 47 (26.1) | <.001 | 6456 |
| Glycemia, mg/dL | 92.0 [85.8;101] | 96.0 [88.9;109] | <.001 | 6411 |
| Diabetes treatment | 544 (8.7) | 44 (24.3) | <.001 | 6456 |
| Hypertension | 2992 (47.7) | 139 (76.8) | <.001 | 6459 |
| Systolic blood pressure, mmHg | 129±19.6 | 140±20.1 | <.001 | 6466 |
| Diastolic blood pressure, mmHg | 77.5±10.1 | 79.6±10.1 | .004 | 6466 |
| Hypertension treatment | 1524 (24.3) | 94 (51.9) | <.001 | 6456 |
| Total cholesterol, mg/dL | 207±35.8 | 211±39.2 | .203 | 6411 |
| LDL cholesterol, mg/dL | 134±30.8 | 139±33.7 | .073 | 6343 |
| HDL cholesterol, mg/dL | 53.4±12.0 | 50.6±11.5 | .001 | 6411 |
| Triglycerides, mg/dL | 86.0 [63.0;118] | 104 [75.5;128] | <.001 | 6412 |
| Dyslipidemia treatment | 1000 (15.9) | 37 (20.6) | .118 | 6456 |
| Carotid stiffness indices | ||||
| Strain x 100 | 9.49 [7.99;11.1] | 8.92 [6.82;10.8] | .001 | 6468 |
| Stiffness parameter | 5.64 [4.63;7.03] | 6.80 [5.27;9.10] | <.001 | 6467 |
| Peterson elasticity coefficient, x 0.1 kPa | 7.12 [5.66;9.17] | 9.13 [6.82;12.2] | <.001 | 6467 |
| Compliance coefficient, kPa−1 | 0.82 [0.66;1.02] | 0.74 [0.56;0.92] | <.001 | 6468 |
| Distensibility coefficient, x 1000kPa−1 | 30.1 [23.3;38.1] | 23.5 [17.6;31.6] | <.001 | 6466 |
| Pulse wave velocity | 5.74 [5.10;6.55] | 6.46 [5.61;7.64] | <.001 | 6467 |
LDL, low-density lipoprotein cholesterol; HDL, high-density lipoprotein cholesterol.
Continuous traits distribution is shown as mean±standard deviation or median [interquartile range: quartile 1; quartile 3]. Categorical traits are shown as No. (%).
Spearman correlation between clinical variables and stiffness indices
| Age | BMI | Gluc | SBP | DBP | T-Cho | LDL | HDL | TG | DC | PWV | Strain | Stiff | Compl | PE | |
|---|---|---|---|---|---|---|---|---|---|---|---|---|---|---|---|
| Age | 1 | 0.190 | 0.240 | 0.467 | 0.002 | 0.075 | 0.043 | 0.015 | 0.180 | −0.621 | 0.634 | −0.290 | 0.618 | −0.446 | 0.633 |
| BMI | <.001 | 1 | 0.371 | 0.361 | 0.321 | 0.027 | 0.042 | −0.282 | 0.361 | −0.258 | 0.269 | −0.097 | 0.186 | −0.085 | 0.265 |
| Gluc | <.001 | <.001 | 1 | 0.344 | 0.222 | 0.043 | 0.030 | −0.197 | 0.330 | −0.274 | 0.281 | −0.098 | 0.212 | −0.125 | 0.280 |
| SBP | <.001 | <.001 | <.001 | 1 | 0.598 | 0.061 | 0.041 | −0.116 | 0.280 | −0.588 | 0.590 | −0.115 | 0.406 | −0.361 | 0.599 |
| DBP | .872 | <.001 | <.001 | <.001 | 1 | 0.113 | 0.108 | −0.099 | 0.227 | −0.271 | 0.272 | −0.189 | 0.068 | −0.159 | 0.271 |
| T-Cho | <.001 | .034 | .001 | <.001 | <.001 | 1 | 0.940 | 0.324 | 0.281 | −0.056 | 0.056 | −0.023 | 0.026 | −0.100 | 0.057 |
| LDLc | .001 | .001 | .018 | .001 | <.001 | <.001 | 1 | 0.132 | 0.206 | −0.036 | 0.035 | −0.018 | 0.010 | −0.064 | 0.036 |
| HDLc | .220 | <.001 | <.001 | <.001 | <.001 | <.001 | <.001 | 1 | −0.412 | 0.077 | −0.082 | 0.043 | −0.062 | −0.066 | −0.080 |
| TG | <.001 | <.001 | <.001 | <.001 | <.001 | <.001 | <.001 | <.001 | 1 | −0.224 | 0.233 | −0.102 | 0.170 | −0.108 | 0.230 |
| DC | <.001 | <.001 | <.001 | <.001 | <.001 | <.001 | .005 | <.001 | <.001 | 1 | −0.990 | 0.703 | −0.931 | 0.773 | −0.992 |
| PWV | <.001 | <.001 | <.001 | <.001 | <.001 | <.001 | .005 | <.001 | <.001 | <.001 | 1 | −0.696 | 0.948 | −0.767 | 0.995 |
| Strain | <.001 | <.001 | <.001 | <.001 | <.001 | .060 | .147 | .001 | <.001 | <.001 | <.001 | 1 | −0.743 | 0.615 | −0.682 |
| Stiff | <.001 | <.001 | <.001 | <.001 | <.001 | .035 | .427 | <.001 | <.001 | <.001 | <.001 | <.001 | 1 | −0.753 | 0.936 |
| Compl | <.001 | <.001 | <.001 | <.001 | <.001 | <.001 | <.001 | <.001 | <.001 | <.001 | <.001 | <.001 | <.001 | 1 | −0.766 |
| PE | <.001 | <.001 | <.001 | <.001 | <.001 | <.001 | .004 | <.001 | <.001 | <.001 | <.001 | <.001 | <.001 | <.001 | 1 |
BMI, body mass index; Compl, compliance coefficient; DBP, diastolic blood pressure; DC, distensibility coefficient; Gluc, glucose; HDLc, cigh density lipoprotein cholesterol; LDLc, low-density lipoprotein cholesterol; PE, Peterson elasticity coefficient; PWV, pulse wave velocity; SBP, systolic blood pressure; Stiff, stiffness; T-Cho, total cholesterol; TG, triglycerides.
Spearman correlation (rho coefficient, above the diagonal; P value, below the diagonal) between clinical variables and stiffness indices of interest.
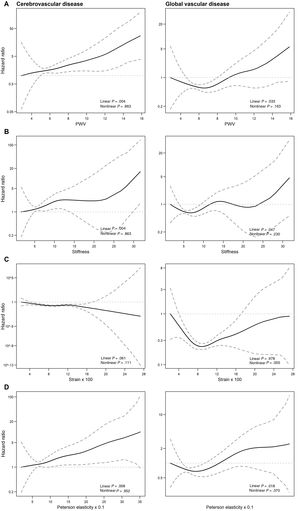
The dose-response association between carotid artery stiffness indices and the outcomes of interest showed 3 patterns (figure 3; figure 1 of the supplementary data): a) compliance and distensibility coefficients were not associated with any of the outcomes of interest; b) PWV, stiffness, and Peterson elasticity coefficient were linearly and directly related to cerebrovascular and overall vascular disease (figure 3A,B,D); and c) strain showed a nonlinear U-shaped relationship to overall vascular disease and IHD (figure 2C; figure 1C of the supplementary data), with an initial risk decrease up to values of 0.09 and a subsequent risk increase from strain values> 0.09.
 of cerebrovascular disease, and overall vascular disease related to several stiffness indices (A-D). The graph was produced using a Cox regression model with spline smoothing functions and 2 degrees of freedom. PWV, pulse wave velocity.")
Predicted relative risk (with 95% confidence limits – dotted lines) of cerebrovascular disease, and overall vascular disease related to several stiffness indices (A-D). The graph was produced using a Cox regression model with spline smoothing functions and 2 degrees of freedom. PWV, pulse wave velocity.
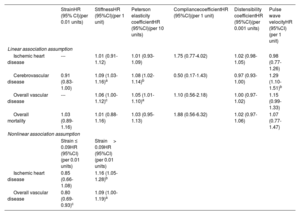
In the multivariate Cox regression model, the risk of cerebrovascular disease increased by 9% (95%CI, 3% to 16%) per stiffness unit increase, by 8% (95%CI, 2-14) per 10-unit increase in Peterson elasticity coefficient, and by 29% (95%CI, 10-51) per PWV unit increase (table 3). When overall vascular disease was analyzed, the risk increase per corresponding stiffness and Peterson elasticity was 6% (95%CI, 0-12), and 5% (95%CI, 1-10%), respectively (table 3).
Multivariate adjusted association between each of the carotid stiffness indices and the outcomes of interest considering competing risk.
| StrainHR (95% CI)(per 0.01 units) | StiffnessHR (95%CI)(per 1 unit) | Peterson elasticity coefficientHR (95%CI)(per 10 units) | CompliancecoefficientHR (95%CI)(per 1 unit) | Distensibility coefficientHR (95%CI)(per 0.001 units) | Pulse wave velocityHR (95%CI)(per 1 unit) | |
|---|---|---|---|---|---|---|
| Linear association assumption | ||||||
| Ischemic heart disease | --- | 1.01 (0.91-1.12) | 1.01 (0.93-1.09) | 1.75 (0.77-4.02) | 1.02 (0.98-1.05) | 0.98 (0.77-1.26) |
| Cerebrovascular disease | 0.91 (0.83-1.00) | 1.09 (1.03-1.16)a | 1.08 (1.02-1.14)b | 0.50 (0.17-1.43) | 0.97 (0.93-1.00) | 1.29 (1.10-1.51)b |
| Overall vascular disease | --- | 1.06 (1.00-1.12)c | 1.05 (1.01-1.10)a | 1.10 (0.56-2.18) | 1.00 (0.97-1.02) | 1.15 (0.99-1.33) |
| Overall mortality | 1.03 (0.89-1.16) | 1.01 (0.88-1.16) | 1.03 (0.95-1.13) | 1.88 (0.56-6.32) | 1.02 (0.97-1.06) | 1.07 (0.77-1.47) |
| Nonlinear association assumption | ||||||
| Strain ≤ 0.09HR (95%CI)(per 0.01 units) | Strain> 0.09HR (95%CI)(per 0.01 units) | |||||
| Ischemic heart disease | 0.85 (0.66-1.08) | 1.16 (1.05-1.28)b | ||||
| Overall vascular disease | 0.80 (0.69-0.93)c | 1.09 (1.00-1.19)a | ||||
95%CI, 95% confidence interval; HR, hazard ratio.
Adjusted for age, sex, body mass index, smoking, diabetes, systolic blood pressure, diastolic blood pressure, low-density lipoprotein cholesterol, high-density lipoprotein cholesterol, triglycerides. Competing risk: noncardiovascular mortality as a competitive event for ischemic heart disease and cerebrovascular disease, ischemic heart disease mortality as a competitive event for cerebrovascular diseases, and cerebrovascular disease mortality as a competitive event for ischemic heart disease. Linear association assumption: a linear association assumption is considered for all the indices. Nonlinear association assumption: analysis of the association between strain and global vascular disease/ischemic heart disease was segmented according to the knot at which a change in the linear dose-response is observed (0.09), and strain is considered as a continuous variable in each of the defined segments, assuming a linear risk in each of the segments.
As the association between strain and overall vascular disease was not linear, the analysis was stratified by the point that best differentiated the 2 patterns of the association: ≤ 0.09 and> 0.09 (figure 2C, table 3). When strain was ≤ 0.09 units, each 0.01 increase was associated with a lower risk of vascular events (HR, 0.80; 95%CI, 0.69-0.93), whereas when strain was> 0.09, each 0.01 increase in strain was associated with a higher risk of vascular events (HR, 1.09; 95%CI, 1.00-1.19). This nonlinear pattern was mainly dependent on IHD risk: when strain was ≤ 0.09 units, each 0.01 increase was associated with a lower risk of coronary events (HR, 0.85; 95%CI, 0.66-1.08), whereas above this value, each 0.01 increase in strain was associated with a higher risk of coronary events (HR, 1.16; 95%CI, 1.05-1.28). Carotid artery stiffness indices were not associated with all-cause mortality.
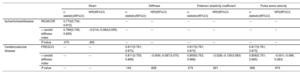
The addition of strain, stiffness, Peterson elasticity coefficient, or PWV on validated IHD or cerebrovascular predictive models did not improve the discrimination or the reclassification of the clinical risk models (table 4).
Analysis of the added predictive capacity of carotid stiffness indices for ischemic heart disease and cerebrovascular events
| Strain | Stiffness | Peterson elasticity coefficient | Pulse wave velocity | ||||||
|---|---|---|---|---|---|---|---|---|---|
| c-statistic(95%CI) | NRI(95%CI) | c-statistic(95%CI) | NRI(95%CI) | c-statistic(95%CI) | NRI(95%CI) | c-statistic(95%CI) | NRI(95%CI) | ||
| Ischemicheartdisease | REGICOR | 0.774(0.734; 0.815) | --- | --- | --- | --- | --- | --- | |
| + carotid stiffness index | 0.789(0.749; 0.829) | −0.014(−0.084;0.055) | --- | --- | --- | --- | --- | --- | |
| P value | .070 | .492 | --- | --- | --- | --- | --- | --- | |
| Cerebrovascular disease | FRESCO | --- | --- | 0.817(0.761; 0.873) | 0.817(0.761; 0.873) | 0.817(0.761; 0.873) | |||
| + carotid stiffness index | --- | --- | 0.811(0.755; 0.868) | −0.009(−0.087;0.070) | 0.809(0.753; 0.866) | −0.028(−0.139;0.083) | 0.808(0.751; 0.865) | −0.001(−0.086; 0.083) | |
| P value | --- | --- | .143 | .828 | .074 | .621 | .066 | .974 | |
95%CI, 95% confidence interval; NRI, categorical net reclassification index (0-4.99%; 5-9.99%; ≥ 10% were used to define the low, intermediate and high risk categories).
The results stratified by sex (tables 5 and 6 of the supplementary data) and the sensitivity analyses were consistent with those observed in the main analysis.
DISCUSSIONIn this study, we analyzed the linear and nonlinear dose-response association of several indices of local carotid artery stiffness with vascular clinical outcomes and overall mortality. We report an independent, linear, and direct association between cerebrovascular disease and carotid stiffness, Peterson elasticity coefficient, and PWV. We also report an independent and nonlinear association between carotid strain and overall vascular disease and IHD, with a clear change in the direction of the association at a strain value of 0.09: an inverse association below this value and direct association above this cutoff. The addition of these indices to specific coronary or cerebrovascular risk functions did not improve predictive capacity.
The association between local carotid stiffness indices and vascular outcomes has been analyzed in previous studies. Three systematic reviews published from 2015 to 2016 summarize the evidence,4,13,14 supporting the association between stiffer carotid arteries and cerebrovascular disease risk in most of the studies15-19 but not in all of them.20-21 These studies also report a lack of association between most of the carotid stiffness indices and IHD risk.4,13,22
In our study, we incorporated one of the largest sample sizes and one of the longest follow-ups to evaluate the correlation between carotid stiffness and vascular disease. Furthermore, we examined both linear and nonlinear dose-response patterns in this relationship. This analysis is crucial in identifying nonlinear patterns that may define specific stiffness values where the effect size of the association shows exponential increase or decline, reaches a plateau, or even changes the direction of the association. We replicated the linear association between some carotid stiffness indices and cerebrovascular disease. The mechanisms explaining this association have been related to an increased pulsatile pressure and flow load, characterized by increased pulse pressure.4
It is difficult to disentangle whether carotid stiffness is a cause or consequence of vascular dysfunction. On the one hand, antihypertensive drugs reduce pulse pressure, improving vascular function, and on the other hand, increased pulse pressure induces vascular and endothelial dysfunction,23,24 and artery hypertrophic remodeling and rarefaction of small cerebral arteries, decreasing vascular relaxation capacity.25 Other proinflammatory, proliferative, pro-oxidant and hemostatic factors26 and carotid intraplaque hemorrhage through rupture-prone atherosclerotic carotid plaques27 have also been proposed as potential actors in this complex relation between arterial stiffness, vascular dysfunction, and clinical events.
Interestingly, we also report a nonlinear association between carotid strain and overall vascular disease, mainly dependent on IHD risk. Carotid strain has not been previously related to IHD risk,4,14 although usually the nonlinear dose-response relationship has not properly been explored, and a linear relation has been assumed. This finding was unexpected (mainly the direct association observed above values of 0.09 units of strain and IHD risk) and we cannot exclude a spurious association as the local carotid stiffness indices could not reflect the local coronary vascular dysfunction. Nevertheless, this nonlinear pattern of association deserves assessment and potential replication in other studies.
Finally, the inclusion of carotid stiffness indices in specific coronary or cerebrovascular risk functions did not improve the predictive capacity of those functions. A previous meta-analysis with individual data reported an improvement in reclassification (continuous NRI, integrated discrimination index) but not in the discrimination capacity of the original model.4 Therefore, the limited added predictive value along with the lack of standardized techniques and reference values could hamper the usefulness of these indices in clinical practice.
The main strength of our study is the population-based sampling, the standardized methodology and the complete follow-up of the participants. However, there are some limitations. First, despite the recommendations of expert consensus to measure pulse pressure at the site of distension,3 we determined pulse pressure from brachial artery measurements, which may not reflect the local pressure conditions at the carotid arteries. Carotid stiffness indices were measured in 2 laboratories, which could introduce some misclassification of the main exposure variables, even though the same methodology was used. However, no differences between laboratories were observed and the results were consistent in sensitivity analyses. Inter- and intrasonographer variability were evaluated using repeated intima-media thickness (IMT) measurements but not stiffness indices. Cerebrovascular events included fatal and nonfatal stroke, but we did not have information related to the type of stroke.
CONCLUSIONSCarotid stiffness, Peterson elasticity coefficient, and PWV are linearly and directly associated with cerebrovascular disease risk. Carotid strain presents a nonlinear U-shaped relation with IHD risk; an initial inverse association up to values of 0.09 and a direct association above this value were observed. However, the inclusion of these stiffness indexes did not improve the predictive capacity of risk functions.
- –
The association between carotid stiffness and cerebrovascular disease has already been documented.
- –
However, the dose-response pattern of this associations has not been properly assessed.
- –
Several carotid stiffness measurements (stiffness, Peterson elasticity coefficient, and PWV) are positively and linearly related to cerebrovascular but not to IHD risk.
- –
The nonlinear association between carotid strain and IHD should be replicated in other studies.
- –
Addition of the stiffness indices did not improve the predictive capacity of validated IHD or cerebrovascular risk models.
This work was supported by the Carlos III Health Institute–European Regional Development Fund [CIBERCV]; PERIS from Agència de Gestió d’Ajuts Universitaris i de Recerca [SLT002/16/00088]; and the Government of Catalonia through the Agency for Management of University and Research Grants [2017SGR946].
ETHICAL CONSIDERATIONSAll the participants were duly informed and signed a written consent form. The study was approved by the Parc de Salut Mar ethics committee (2016/7075/I). Gender dimensions have been considered in the recruitment, data collection and analyses.
STATEMENT ON THE USE OF ARTIFICIAL INTELLIGENCEDuring the preparation of this work the authors did not use any artificial intelligence tool.
AUTHORS’ CONTRIBUTIONSSubstantial contribution to the conception and design of the work: R. Elosua, R. Arnold, E. de Groot, I. R. Degano, J. Marrugat, R. Ramos. Substantial contribution to the acquisition of the data of the work: R. Elosua, R. Arnold, E. de Groot, R. Martí-Lluch, I. R. Degano, J. Marrugat, R. Ramos. Substantial contribution to the analysis and interpretation of the work: R. Elosua, A. Toloba, R. Ramos. Drafting the work: R. Elosua, R. Ramos. Reviewing the work critically for important intellectual content: A. Toloba, R. Arnold, E. de Groot, R. Martí-Lluch, I. R. Degano, J. Marrugat. Final approval of the version to be published: R. Elosua, A. Toloba, R. Arnold, E. de Groot, R. Martí-Lluch, I. R. Degano, J. Marrugat, R. Ramos. Agreement to be accountable for all aspects of the work in ensuring that questions related to the accuracy or integrity of any part of the work are appropriately investigated and resolved: R. Elosua, A. Toloba, R. Arnold, E. de Groot, R. Martí-Lluch, I. R. Degano, J. Marrugat, R. Ramos.
CONFLICTS OF INTERESTNone.
We thank Elaine M. Lilly, PhD, for her critical reading and revision of the English text.