We analyzed the clinical and cost-effectiveness results of an extended hours on-call program for pacemaker implantations in patients with indications for implantation admitted during weekends and holidays. A secondary objective was to compare the rate of acute complications during hospitalization and postdischarge before and after implementation of the program.
We performed a retrospective analysis of 2 periods: period 1 (January 2, 2017 to December 31, 2019; Monday to Friday), which was prior to the implementation of the program; and period 2 (1 January, 2020 to 8 October, 2022; weekends/holidays), when the program was implemented in the electrophysiology unit with a team of 4 accredited staff. We included patients who were admitted from 3:00 pm on Friday/holiday evenings to approximately 6:00 pm on Sunday. The program is committed to implantation within 24hours of admission, but does not include patients who have undergone cardiac surgery or percutaneous valve implantation or those with conduction disturbances in the context of acute coronary syndrome.
We performed a cost analysis. The results are expressed at 2 levels: a) benefits calculated as costs saved in hospital stays; and b) costs to society in mortality costs. The costs of hospital stays are established as rates by Government Decree1: a) the cost of hospitalization is €528.95 per stay in a ward and €1142.47 per stay in an ICU); b) the death of an active worker was estimated according to the expected benefits in decreased incidence, mortality, and potential years of working life lost, taking into account the average gross income (€18 768.21/y) and the unemployment rate (7.9%) in our area as of December 31, 2019; c) the premature death of an active worker was estimated according to the expected benefits in decreased incidence, mortality, and potential years of working life lost by estimating the economic value derived from the lost wages of the average gross income per worker by area (€18 768.21/y); and d) the death of a retired person was estimated according to the expected benefits in decreased incidence, mortality, and potential years of life lost in relation to average life expectancy, while taking into account the percentage of people of at least 65 years who perform voluntary work according to the results of the CIS-IMSERSO study (2.3%)2, retired persons dedicated to caring for grandchildren according to the results of the Sociological Research Center study (22.6%)3, and the Spanish Multiplier for the Public Income Index (IPREM) (€7519.59/y)4.
The result of the cost-effectiveness analysis is presented as the incremental cost-effectiveness ratio (ICER). The ICER was calculated as the incremental cost divided by the incremental effectiveness of the period 1 program vs the period 2 program—Q(CQ1-CQ2)/(EQ1-E2)—in which C represents the cost, E represents effectiveness (survival per month), Q1 represents Monday-to-Friday implantations, and Q2 represents weekend implantations. The cost/efficacy relationship used in the decision tree was based on mean costs and mean efficacy (survival). Statistical analyses were performed using Stata/IC software version 16.1 (StataCorp, United States). The ICERs were calculated using the Markov chain model. Monte Carlo simulation was used to model the random behavior of the real-world static system of pacemaker implantation outcomes (length of stay and premature death) based on a normal distribution of the available data. Model inputs (staff costs) were identified and random samples were generated. The simulation was run 10 000 times, thus yielding 10 000 observations of the model's behaviour.5,6 The simulation model was fitted to the effectiveness of each program and the cost of each program.
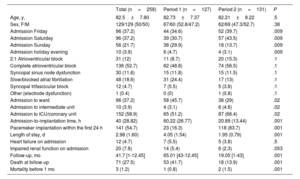
A total of 258 consecutive patients were included, 127 in period 1 (corresponding to 17.3% of the total number of pacemakers implanted in that period) and 131 (13.4%) in period 2 (table 1). Acute complications included a hematoma and a dislocation in period 1, and a small apical pneumothorax and a death secondary to stroke in period 2. Complications during hospitalization included 12 (4.7%) heart failure exacerbations: 7 (5.5%) in period 1 and 5 (3.8%) in period 2 (P=.5); and 20 (7.8%) kidney failure exacerbations: 14 (11%) in period 1 and 6 (4.6%) and in period 2 (P=.053). During the postdischarge period, there were 71 (27.5%) deaths: 53 (41.7%) in period 1 and 18 (13.7%) in period 2 (P<0.001).
Baseline characteristics of the patients and events analyzed.
| Total (n=258) | Period 1 (n=127) | Period 2 (n=131) | P | |
|---|---|---|---|---|
| Age, y, | 82.5±7.80 | 82.73±7.37 | 82.21±8.22 | .5 |
| Sex, F/M | 129/129 (50/50) | 67/60 (52.8/47.2) | 62/69 (47.3/52.7) | .38 |
| Admission Friday | 96 (37.2) | 44 (34.6) | 52 (39.7) | .009 |
| Admission Saturday | 96 (37.2) | 39 (30.7) | 57 (43.5) | .009 |
| Admission Sunday | 56 (21.7) | 38 (29.9) | 18 (13.7) | .009 |
| Admission holiday evening | 10 (3.9) | 6 (4.7) | 4 (3.1) | .009 |
| 2:1 Atrioventricular block | 31 (12) | 11 (8.7) | 20 (15.3) | .1 |
| Complete atrioventricular block | 136 (52.7) | 62 (48.8) | 74 (56.5) | .1 |
| Syncopal sinus node dysfunction | 30 (11.6) | 15 (11.8) | 15 (11.5) | .1 |
| Slow/blocked atrial fibrillation | 48 (18.6) | 31 (24.4) | 17 (13) | .1 |
| Syncopal trifascicular block | 12 (4.7) | 7 (5.5) | 5 (3.8) | .1 |
| Other (electrode dysfunction) | 1 (0.4) | 0 (0) | 1 (0.8) | .1 |
| Admission to ward | 96 (37.2) | 58 (45.7) | 38 (29) | .02 |
| Admission to intermediate unit | 10 (3.9) | 4 (3.1) | 6 (4.6) | .02 |
| Admission to ICU/coronary unit | 152 (58.9) | 65 (51.2) | 87 (66.4) | .02 |
| Admission-to-implantation time, h | 40 (28.82) | 60.22 (26.77) | 20.89 (13.44) | .001 |
| Pacemaker implantation within the first 24 h | 141 (54.7) | 23 (16.3) | 118 (83.7) | .001 |
| Length of stay, d | 2.98 (1.60) | 4.05 (1.54) | 1.95 (0.79) | .001 |
| Heart failure on admission | 12 (4.7) | 7 (5.5) | 5 (3.8) | .5 |
| Impaired renal function on admission | 20 (7.8) | 14 (5.4) | 6 (2.3) | .053 |
| Follow-up, mo | 41.7 [1-12.45] | 65.01 [43-12.45] | 19.05 [1-43] | .001 |
| Death at follow-up | 71 (27.5) | 53 (41.7) | 18 (13.9) | .001 |
| Mortality before 1 mo | 3 (1.2) | 1 (0.8) | 2 (1.5) | .001 |
F, female; ICU, intensive care unit; M, male.
Data are expressed as No. (%), mean±standard deviation, or mean [interquartile range].
The mean cost per patient per stay was higher in period 1 (€3419.63) than in period 2 (€2447.27). The mean cost per premature death was also higher in period 1 (€1724.65) than in period 2 (€678.37). The mean cost of staff per patient was €531.24. The mean total cost per patient for the period 2 model (€3656.89) was 71.08% of the mean total cost per patient of the period 1 model (€5144.28). The total cost of patients was €653 323.56 in period 1 and €479 052.59 in period 2. The ICER value (−€5987.38) was well below the acceptability threshold of €10 000 per life year gained, thus showing that the program lowers costs and increases effectiveness and can thus be recommended due to its cost-effectiveness. The Monte Carlo sensitivity analysis showed that the program was cost-effective in 83% of the simulated cases.
In summary, these results are the first to show a decrease in length of hospital stay with significant reductions in costs but without increases in acute complications: we believe this program could be implemented in other centers.
The study has a number of limitations. The study was nonrandomized. there may have been selection bias, events were not analyzed according to patients’ clinical profile, no information was collected on patient satisfaction, the program did not include patients admitted after 6:00 pm on Sundays; there were differences in the place of admission during both periods, which could have affected the complication rate, and staff pay may differ between one center and another. Indeed, costs may have differed due to the program not taking into account payment for being on-call outside regular working hours.
FUNDINGNone declared.
AUTHORS’ CONTRIBUTIONSM. Rodríguez-Mañero was in charge of analyzing the results and drafting the manuscript. F. Reyes and V. Caballer-Tarazona performed the cost analysis. J. García-Seara, J.L. Martínez-Sande, and J.R. González-Juanatey assisted in drafting the manuscript.
CONFLICTS OF INTERESTNone declared.