Conflicting results have been reported on the possible existence of sex differences in mortality after myocardial infarction (MI). There is also a scarcity of data on the impact of sex on outcomes after ST-segment elevation myocardial infarction (STEMI) and non-STEMI (NSTEMI). The aim of this study was to analyze sex difference trends in sex-related differences in mortality for STEMI and NSTEMI.
MethodsA retrospective analysis of 445 145 episodes of MI (2005-2015) was carried out using information from the Spanish National Health System. The incidence rates were expressed as events per 10 000 person-years. The denominators (age-specific groups) were obtained from the nationwide census. We calculated crude and adjusted (multilevel logistic regression) mortality. Poisson regression analysis was used to study temporal trends for in-hospital mortality.
ResultsA total of 69.8% episodes occurred in men. The mean age in men was 66.1±13.3 years, which was significantly younger than in women, 74.9±12.1 (P<.001). A total of 272 407 (61.2%) episodes were STEMI, and 172 738 (38.8%) were NSTEMI. Women accounted for 28.8% of STEMI and 33.9% of NSTEMI episodes (P <.001). The effect of female sex on risk-adjusted models for in-hospital mortality was the opposite in STEMI (OR for women, 1.18; 95%CI, 1.14-1.22; P <.001) and NSTEMI (OR for women, 0.85; 95%CI, 0.81-0.89; P <.001). MI hospitalization rates were higher in men than in women for all age groups [20 vs 7.7 per 10 000 individuals aged 35-94 years (P <.001)], with a trend to diminish in both sexes.
ConclusionsWomen had a slight but significantly increased risk of in-hospital mortality after MI, but the effect of sex depended on MI type, with women exhibiting higher mortality for STEMI and lower mortality for NSTEMI
Keywords
Cardiovascular disease is the leading causes of death and disability in both men and women.1,2 Over the last few years, prognosis after myocardial infarction (MI) has improved, although outcomes appear to remain worse in women.3,4 Nevertheless, conflicting results have been published on the possible existence of sex differences in mortality following MI.5–8 Futhermore, it remains incompletely understood whether there are true sex-related differences in mortality after myocardial ischemia, or whether they are associated with the older age or the higher prevalence of comorbidity observed in women.9 Several studies have reported contradictory results after adjustment for clinical and demographics patient characteristics, finding that the differences between sexes at baseline only explained some of the excess of mortality usually found in women.1 Most studies have analyzed the impact of sex on mortality in overall MI, without distinguishing between ST-segment elevation myocardial infarction (STEMI) and non-STEMI (NSTEMI),10 despite the significant differences between the 2 entities in terms of pathophysiology, treatment and prognosis, all of which could be modulated by sex. In a small sample, Hochman et al.11 found that there were differences in outcomes between women and men according to the type of acute coronary syndrome (ACS), with women having lower rates of adverse events in unstable angina, but similar outcomes to men in STEMI and NSTEMI. Marrugat et al.,12 also analyzed differences in mortality according to the type of ACS and found that mortality rates were higher in women with first Q-wave MI but not in the other patients after adjustment for confounding variables. Berger et al.13 studied a sample of pooled data of ACS clinical trials with a total of 136 247 patients, and found that women had an overall 30-day mortality that was 15% higher, but with lower mortality in NSTEMI and unstable angina, which could be mostly explained by clinical differences at presentation and the severity of angiographically documented disease. More recently, Freisinger et al.14 analyzed a nationwide dataset of patients hospitalized for ACS in Germany and reported that women had higher in-hospital mortality, mostly due to a more unfavorable risk profile and age distribution.
Therefore, the aim of this study was to investigate the relationship between sex and in-hospital mortality by type of MI (STEMI and NSTEMI) in a large contemporary population in Spain, as well as to analyze the trend in hospital discharges for MI by sex an age in 11 years (2005-2015).
METHODSData source, population, and designWe conducted a retrospective longitudinal study using information provided by the minimum data set (MDS) of the Spanish National Health System (SNHS), which includes information on the demographic characteristics of patients discharged from hospitals of the SNHS, as well as administrative variables related to the patient's diseases and procedures performed during the episode, coded according to the International Classification Disease Ninth Review, Clinical Modification (ICD-9-CM).15 All episodes with a principal discharge diagnosis of STEMI or NSTEMI from January 1, 2005 to December 31, 2015 were included. Principal diagnosis of STEMI was identified by ICD-9-CM codes (410.*1, except 410.71), and NSTEMI by 410.71 code. Percutaneous coronary intervention was identified by ICD-9-CM procedure codes 00.66, 36.01, 36.02, 36.05, 36.06, and 36.07, and thrombolysis by V45.88 and 99.10 codes.
We adapted the models developed by the Medicare and Medicaid Services16 to the data structure of the SNHS MDS. Episodes requiring transfers between hospitals were considered as a single episode, and clinical results were assigned to the center finally discharging the patient. Discharges to other hospitals were only excluded when we were unable to identify the destination hospital. We also excluded all episodes lacking a record of age, sex, admission date or principal diagnosis, patients aged <35 and> 94 years, those who were discharged alive 1 day after admission or less, and those in which the reason of discharge was not clear or was taken against medical advice, as well as those classified as mayor diagnostic category 14 (pregnancy, delivery, puerperium) of the All Patient Refined Diagnosis Related Groups.17 The quality of the SNHS MDS for the study of ACS has been previously validated.18
The SNHS covers 98.5% of the Spanish population. The incidence rates of AMI, STEMI and NSTEMI are expressed as the number of episodes per 10 000 person-years. The denominators (age-specific groups) were obtained from the nationwide census. Age groups were as follows: 35-44, 45-54, 55-64, 65-74, 75-84 and 85-94 years.
Statistical analysisContinuous variables are expressed as a mean (SD) and categorical variables as numbers and rates. The correlation between continuous variables was analyzed by the Spearman rank correlation coefficient (p). The Student t-test was used to compare 2 categories and ANOVA corrected by the Bonferroni test to compare 3 or more. Categorical variables were compared by the chi-square test or Fisher exact test.
Since the probability of a patient dying is, indeed, a combination of their individual risk factors (casemix) and the quality of care provided (performance), the risk-standardized in-hospital mortality ratio (RSMR) was defined as the ratio between predicted mortality (which individually considers the performance of the hospital attending the patient) and expected mortality (which considers a standard performance according to the average of all hospitals) multiplied by the crude mortality rate. RSMR were calculated using multilevel models developed by the Medicare and Medicaid Service for risk-adjustment, adapted to the structure of the MDS database, in which hospitals were modeled as a random intercept considering both interhospital variability and clinical and demographic variables.19–21
Secondary diagnoses were included in groups of risk factors (condition categories) as described by Pope,22 which are updated each year by the Agency for Health Research and Quality. All factors included in the final models and their coefficients were calculated from our data. Levels of significance for selecting and eliminating risk factors were P <.05 and P ≥ .10, respectively. If RSMR from 1 hospital is higher than the crude rate of mortality, the risk of death in this center is higher than the mean risk of all hospitals. Calibration of models was assessed by calculating risk tertiles of the in-hospital observed and expected mortality obtained by the logistic multilevel model. To evaluate the goodness-of-fit, a significant decrease in the statistical likelihood ratio test compared with the null model was tested. Median odds ratio was used as a measure of heterogeneity of RSMR between hospitals, if the median odds ratio was equal to 1 there would be no differences between hospitals. The median odds ratio of the multilevel adjustment models measured the magnitude of variance at the hospital level.
The discrimination of the models was assessed by the area under the receiver operating characteristics curve (AUROC). RSMR was used to compare outcomes related to sex and sex differences. When analyzing differences in risk factors between the in-hospital mortality risk-adjustment models for STEMI and NSTEMI, we considered those without overlapping of their odds ratio coefficient interval as statistically significant.
Temporal trends for in-hospital mortality during the observed period were modeled using Poisson regression analysis with year as the only independent variable. In all models, incidence rate ratios (IRR) and their 95% confidence intervals (95%CI) were calculated.
All statistical tests were 2-sided, and the level of significance for P was set at .05. The statistical analysis was performed using STATA 13 and SPSS 21.0
RESULTSA total 522 273 episodes of MI were identified in the MDS during the study period (2005-2015). Fifteen percent of the episodes were excluded due to several reasons: discharge to other hospitals (11.2%), unknown/undetermined sex (1.3%), age (1.3%), discharge to home alive within 2 days of admission (1.3%), or discharge to nursing home/office, not clear or taken against medical advice (1.1%) (not mutually exclusive). A total of 445 145 episodes were selected. A total of 69.8% of the patients were male, with a mean age of 66.1 (13.3) years, which was significantly younger than in women 74.9 (12.1) (P <.001). A total of 272 407 (61.2%) episodes were STEMI, and 172 738 (38.8%) NSTEMI. Women accounted for 28.8% of STEMI and 33.9% of NSTEMI episodes (P <.001).
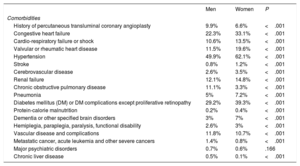
Baseline characteristicsThe patients’ baseline characteristics are shown in table 1. Comorbidities were more frequent in women, except for conditions related to cancer, chronic obstructive pulmonary disease, and chronic liver disease. The rate of percutaneous coronary intervention without thrombolysis for the whole group was 50.1% for men and 34.1% for women. The rate of percutaneous coronary intervention without thrombolysis was 48.5% in STEMI and 39.8% in NSTEMI.
Most common comorbidities in men and women with acute myocardial infarction
| Men | Women | P | |
|---|---|---|---|
| Comorbidities | |||
| History of percutaneous transluminal coronary angioplasty | 9.9% | 6.6% | <.001 |
| Congestive heart failure | 22.3% | 33.1% | <.001 |
| Cardio-respiratory failure or shock | 10.6% | 13.5% | <.001 |
| Valvular or rheumatic heart disease | 11.5% | 19.6% | <.001 |
| Hypertension | 49.9% | 62.1% | <.001 |
| Stroke | 0.8% | 1.2% | <.001 |
| Cerebrovascular disease | 2.6% | 3.5% | <.001 |
| Renal failure | 12.1% | 14.8% | <.001 |
| Chronic obstructive pulmonary disease | 11.1% | 3.3% | <.001 |
| Pneumonia | 5% | 7.2% | <.001 |
| Diabetes mellitus (DM) or DM complications except proliferative retinopathy | 29.2% | 39.3% | <.001 |
| Protein-calorie malnutrition | 0.2% | 0.4% | <.001 |
| Dementia or other specified brain disorders | 3% | 7% | <.001 |
| Hemiplegia, paraplegia, paralysis, functional disability | 2.6% | 3% | <.001 |
| Vascular disease and complications | 11.8% | 10.7% | <.001 |
| Metastatic cancer, acute leukemia and other severe cancers | 1.4% | 0.8% | <.001 |
| Major psychiatric disorders | 0.7% | 0.6% | .166 |
| Chronic liver disease | 0.5% | 0.1% | <.001 |
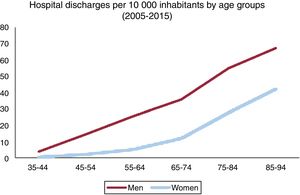
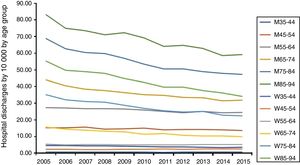
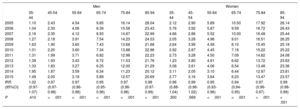
MI hospitalization discharges per 1000 inhabitants/y were higher in men than in women for all age groups [20 vs 7.7 per 10 000, 35- to 94-year-old inhabitants (P <.001) (figure 1)], with a trend to diminish throughout the study period for both men and women in all age groups, except for women aged 45-54 years (figure 2). The mean rate of hospitalizations weighted by age diminished during the 2003-2015 period (IRR, 0.974; 95%CI, 0.970-0.977- for men; IRR, 0.965; 95%CI, 0.962-0.968- for women; P <.001 for both). The mean crude in-hospital mortality rate also diminished throughout the study period in both men and women (IRR, 0.968 for men and 0.972 for women; P <.001). However, in-hospital crude mortality did not significantly decrease in either young men (35-44 years) or women (35-44 and 45-54 years) (table 2). For all age groups, the in-hospital crude mortality rate was significantly higher for women (P <.001).
, hospital discharges were more frequent in men than in women in all age groups analyzed. The difference in hospital discharges tended to rise as the age of the patients increased.")

Trends in hospitalization rates for AMI in men and women by age groups. A tendency to decrease the rate of hospitalization due to AMI can be observed in the different age groups, both in men and women, during the study period. 35-44, age between 35 and 44 years, etc; AMI, acute myocardial infarction; M, men; W, women.
Trends in crude in-hospital mortality by sex and age groups (2005-2015)
| Men | Women | |||||||||||
|---|---|---|---|---|---|---|---|---|---|---|---|---|
| 35-44 | 45-54 | 55-64 | 65-74 | 75-84 | 85-94 | 35-44 | 45-54 | 55-64 | 65-74 | 75-84 | 85-94 | |
| 2005 | 1.10 | 2.43 | 4.54 | 9.65 | 16.14 | 26.04 | 2.12 | 2.90 | 5.89 | 10.50 | 17.92 | 26.14 |
| 2006 | 1.04 | 2.30 | 4.06 | 8.39 | 15.58 | 23.43 | 5.76 | 3.92 | 5.87 | 9.59 | 16.72 | 26.43 |
| 2007 | 2.16 | 2.35 | 4.12 | 8.93 | 14.87 | 22.99 | 4.66 | 2.86 | 5.52 | 10.00 | 16.48 | 25.44 |
| 2008 | 1.27 | 2.18 | 3.91 | 7.54 | 14.23 | 24.53 | 2.05 | 3.28 | 4.96 | 9.01 | 16.51 | 26.25 |
| 2009 | 1.63 | 1.90 | 3.60 | 7.43 | 13.68 | 21.68 | 2.64 | 3.99 | 4.58 | 8.10 | 15.45 | 25.18 |
| 2010 | 1.01 | 2.20 | 3.60 | 7.34 | 13.88 | 22.96 | 2.92 | 2.87 | 4.45 | 7.18 | 15.22 | 25.22 |
| 2011 | 1.31 | 1.99 | 3.71 | 6.82 | 12.98 | 22.23 | 2.73 | 3.28 | 4.50 | 7.09 | 14.82 | 24.08 |
| 2012 | 1.39 | 1.93 | 3.43 | 6.72 | 11.53 | 21.76 | 1.23 | 3.80 | 4.61 | 6.62 | 13.72 | 23.63 |
| 2013 | 1.33 | 1.83 | 3.27 | 6.25 | 12.00 | 21.29 | 3.08 | 3.61 | 4.06 | 6.54 | 13.48 | 23.36 |
| 2014 | 1.95 | 1.87 | 3.59 | 6.34 | 11.23 | 20.12 | 3.11 | 2.05 | 3.10 | 6.44 | 12.97 | 23.81 |
| 2015 | 1.49 | 2.00 | 3.19 | 5.89 | 12.57 | 20.69 | 2.77 | 3.16 | 3.64 | 6.23 | 13.47 | 23.57 |
| IRR (95%CI) | 1.02 (0.97-1.07) | 0.97 (0.97-0.98) | 0.97 (0.96-0.98) | 0.95 (0.95-0.96) | 0.97 (0.96-0.98) | 0.98 (0.97-0.99) | 0.96 (0.88-1.04) | 0.99 (0.96-1.02) | 0.95 (0.93-0.96) | 0.94 (0.94-0.95) | 0.97 (0.96-0.97) | 0.99 (0.98-0.99) |
| P | .410 | <.001 | <.001 | <.001 | <.001 | <.001 | .300 | .569 | <.001 | <.001 | <.001 | < .001 |
IRR, incidence rate ratios.
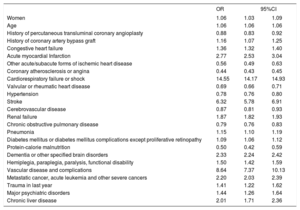
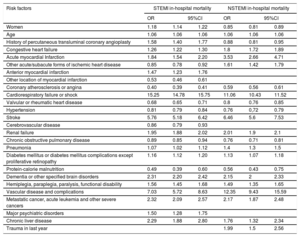
Clinical and demographic variables independently associated with in-hospital mortality in the multilevel risk-adjustment model are shown in table 3. This model showed a good discriminatory ability (AUROC, 0.894; 95%CI, 0.893-0.896) and calibration (P < .001), with a mean OR of 1.39, pointing to high interhospital variability. Female sex was independently associated with slightly higher in-hospital mortality after MI (OR, 1.05; 95%CI, 1.026-1.083; P <.001). However, the effect of sex on risk-adjustment models for in-hospital mortality differed in STEMI and NSTEMI, with women having higher mortality in STEMI (OR for women, 1.18; 95%CI, 1.14.-1.22; P <.001) and lower mortality in NSTEMI (OR for women, 0.85; 95%CI, 0.81-0.89; P <.001). Furthermore, risk-adjustment models for in-hospital mortality were markedly different for STEMI and NSTEMI (figure 3), both for the composition of the risk factors and their weight (table 4). Variability among hospitals was higher for NSTEMI (median odds ratio=1.47) than for STEMI (median odds ratio=1.31).
Risk factors for in-hospital mortality adjusted for potential confounders in patient with acute myocardial infarction in a multilevel logistic regression in the Spanish minimum basic data set for hospital admissions 2005-2015
| OR | 95%CI | ||
|---|---|---|---|
| Women | 1.06 | 1.03 | 1.09 |
| Age | 1.06 | 1.06 | 1.06 |
| History of percutaneous transluminal coronary angioplasty | 0.88 | 0.83 | 0.92 |
| History of coronary artery bypass graft | 1.16 | 1.07 | 1.25 |
| Congestive heart failure | 1.36 | 1.32 | 1.40 |
| Acute myocardial Infarction | 2.77 | 2.53 | 3.04 |
| Other acute/subacute forms of ischemic heart disease | 0.56 | 0.49 | 0.63 |
| Coronary atherosclerosis or angina | 0.44 | 0.43 | 0.45 |
| Cardiorespiratory failure or shock | 14.55 | 14.17 | 14.93 |
| Valvular or rheumatic heart disease | 0.69 | 0.66 | 0.71 |
| Hypertension | 0.78 | 0.76 | 0.80 |
| Stroke | 6.32 | 5.78 | 6.91 |
| Cerebrovascular disease | 0.87 | 0.81 | 0.93 |
| Renal failure | 1.87 | 1.82 | 1.93 |
| Chronic obstructive pulmonary disease | 0.79 | 0.76 | 0.83 |
| Pneumonia | 1.15 | 1.10 | 1.19 |
| Diabetes mellitus or diabetes mellitus complications except proliferative retinopathy | 1.09 | 1.06 | 1.12 |
| Protein-calorie malnutrition | 0.50 | 0.42 | 0.59 |
| Dementia or other specified brain disorders | 2.33 | 2.24 | 2.42 |
| Hemiplegia, paraplegia, paralysis, functional disability | 1.50 | 1.42 | 1.59 |
| Vascular disease and complications | 8.64 | 7.37 | 10.13 |
| Metastatic cancer, acute leukemia and other severe cancers | 2.20 | 2.03 | 2.39 |
| Trauma in last year | 1.41 | 1.22 | 1.62 |
| Major psychiatric disorders | 1.44 | 1.26 | 1.64 |
| Chronic liver disease | 2.01 | 1.71 | 2.36 |
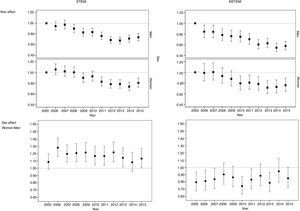
 corresponding to the year variable in the in-hospital mortality adjustment model for the period 2005 to 2015 show a declining year-on-year trend for both men and women in STEMI and NSTEMI. Bottom: the ORs for sex variable (female vs male) of annual in-hospital mortality adjustment models show that female sex is a risk factor in STEMI (OR> 1) and protector in NSTEMI (OR <1) each year in both cases. NSTEMI, non–ST-segment elevation myocardial infarction; STEMI, ST-segment elevation myocardial infarction.")
Differences in in-hospital mortality after STEMI versus NSTEMI by sex. Top: the odds ratios (ORs) corresponding to the year variable in the in-hospital mortality adjustment model for the period 2005 to 2015 show a declining year-on-year trend for both men and women in STEMI and NSTEMI. Bottom: the ORs for sex variable (female vs male) of annual in-hospital mortality adjustment models show that female sex is a risk factor in STEMI (OR> 1) and protector in NSTEMI (OR <1) each year in both cases. NSTEMI, non–ST-segment elevation myocardial infarction; STEMI, ST-segment elevation myocardial infarction.
2015 risk factors of in-hospital mortality adjusted for potential confounders in patients with STEMI and NSTEMI in a multilevel logistic regression in the Spanish minimum data set for hospital admissions 2005-2015
| Risk factors | STEMI in-hospital mortality | NSTEMI in-hospital mortality | ||||
|---|---|---|---|---|---|---|
| OR | 95%CI | OR | 95%CI | |||
| Women | 1.18 | 1.14 | 1.22 | 0.85 | 0.81 | 0.89 |
| Age | 1.06 | 1.06 | 1.06 | 1.06 | 1.06 | 1.06 |
| History of percutaneous transluminal coronary angioplasty | 1.58 | 1.40 | 1.77 | 0.88 | 0.81 | 0.95 |
| Congestive heart failure | 1.26 | 1.22 | 1.30 | 1.8 | 1.72 | 1.89 |
| Acute myocardial Infarction | 1.84 | 1.54 | 2.20 | 3.53 | 2.66 | 4.71 |
| Other acute/subacute forms of ischemic heart disease | 0.85 | 0.78 | 0.92 | 1.61 | 1.42 | 1.79 |
| Anterior myocardial infarction | 1.47 | 1.23 | 1.76 | |||
| Other location of myocardial infarction | 0.53 | 0.46 | 0.61 | |||
| Coronary atherosclerosis or angina | 0.40 | 0.39 | 0.41 | 0.59 | 0.56 | 0.61 |
| Cardiorespiratory failure or shock | 15.25 | 14.78 | 15.75 | 11.06 | 10.43 | 11.52 |
| Valvular or rheumatic heart disease | 0.68 | 0.65 | 0.71 | 0.8 | 0.76 | 0.85 |
| Hypertension | 0.81 | 0.79 | 0.84 | 0.76 | 0,72 | 0.79 |
| Stroke | 5.76 | 5.18 | 6.42 | 6.46 | 5.6 | 7.53 |
| Cerebrovascular disease | 0.86 | 0.79 | 0.93 | |||
| Renal failure | 1.95 | 1.88 | 2.02 | 2.01 | 1.9 | 2.1 |
| Chronic obstructive pulmonary disease | 0.89 | 0.85 | 0.94 | 0.76 | 0.71 | 0.81 |
| Pneumonia | 1.07 | 1.02 | 1.12 | 1.4 | 1.3 | 1.5 |
| Diabetes mellitus or diabetes mellitus complications except proliferative retinopathy | 1.16 | 1.12 | 1.20 | 1.13 | 1.07 | 1.18 |
| Protein-calorie malnutrition | 0.49 | 0.39 | 0.60 | 0.56 | 0.43 | 0.75 |
| Dementia or other specified brain disorders | 2.31 | 2.20 | 2.42 | 2.15 | 2 | 2.33 |
| Hemiplegia, paraplegia, paralysis, functional disability | 1.56 | 1.45 | 1.68 | 1.49 | 1.35 | 1.65 |
| Vascular disease and complications | 7.03 | 5.72 | 8.63 | 12.35 | 9.43 | 15.59 |
| Metastatic cancer, acute leukemia and other severe cancers | 2.32 | 2.09 | 2.57 | 2.17 | 1.87 | 2.48 |
| Major psychiatric disorders | 1.50 | 1.28 | 1.75 | |||
| Chronic liver disease | 2.29 | 1.88 | 2.80 | 1.76 | 1.32 | 2.34 |
| Trauma in last year | 1.99 | 1.5 | 2.56 | |||
95%CI, 95% confidence interval; OR, odds ratio.
This study shows some important findings in the populations of patients with MI: a) hospital discharge rates for MI are notoriously lower for women than for men. Women discharged for MI are older and have more comorbidities than men, except for conditions related to cancer, chronic obstructive pulmonary disease and chronic liver disease, and their mortality, whether crude or risk-adjusted is much higher than that in men; b) NSTEMI as the principal diagnosis after discharge for MI is more frequent in women than in men; c) overall hospital discharge rates for MI significantly diminished throughout the study period (2005-2015), more steeply in women, except for women 45 to 54 years old; d) in overall MI, in-hospital crude mortality was significantly higher for women in all age groups; although the crude in-hospital mortality rate significantly diminished throughout the study period, it did not change in young men (35-44 years old) or women (35-44 and 45-54 years old); d) the effect of sex on risk-adjustment models for in-hospital mortality depended on the type of MI: women had higher mortality in STEMI and lower mortality in NSTEMI; and e) risk-adjustment models for in-hospital mortality were markedly different for STEMI and NSTEMI, which precludes analysis of the impact of different variables on in-hospital mortality without differentiating between STEMI and NSTEMI.
In our series, as previously published,11,23,24 NSTEMI was more frequent MI in women than in men, probably due to the more common presence of MI with nonobstructive coronary artery disease in women, as women are more likely to show less frequent pathophysiological mechanisms of myocardial ischemia, such as coronary artery spasm, coronary artery dissection, microvascular disease, etc.25
Furthermore, in our population, mortality after MI was higher in women than in men regardless of age. Other authors found that women died more frequently than men 5 years after having had a first MI (47% vs 36%, respectively). This higher unadjusted mortality at 5 years, as well as at 10 years, was explained partially by differences in age, MI risk factors, clinical presentation, and treatment.26 Nevertheless, as we have found in our series, in the past decade, cardiovascular mortality has markedly decreased in women, most probably due to an increase in awareness, a greater focus on women and their cardiovascular risk, and the application of evidence-based treatments.25 As cardiovascular disease remains a leading cause of mortality in women, further efforts are needed to continue to reduce mortality due to MI in women, especially because a reduction in mortality after MI was not observed in the youngest age groups in our series.
Globally, women with MI are older and have a more unfavorable risk profile than men, which could explain the higher mortality observed in women by most authors.8,27 This highlights the need to perform adequate risk adjustment in the mathematical model used to properly separate each of the factors involved in the increase of in-hospital mortality. Although some authors have performed mathematical adjustment for baseline clinical and angiographic differences, which could reduce the differences in crude mortality, none has performed a complete adjustment for clinical variables, which could have contributed to some relevant differences being missed. Hochman et al.11 performed an analysis of the GUSTO IIb trial and found that there were differences in outcomes between women and men according to the type of ACS, with women having lower rates of adverse events in unstable angina, but similar outcomes to men in STEMI and NSTEMI. Berger et al.13 studied a sample of pooled data of 11 independent, international, randomized ACS clinical trials, which included the GUSTO IIb trial, between 1993 and 2006, whose databases were maintained at the Duke Clinical Research Institute, Durham, North Carolina. They included a total of 136 247 patients, 38 048 (29%) of whom were women: 7857 unstable angina, 26 032 STEMI and 4159 NSTEMI. In women, overall 30-day mortality was 15% higher after STEMI, whereas it was lower in NSTEMI and unstable angina (23% and 45% lower, respectively), which could be mostly explained by clinical differences at presentation and severity of angiographically documented disease. These findings are similar to those found more recently by Freisinger et al.,14 who analyzed a nationwide dataset of patients hospitalized for ACS in Germany and reported that women had higher in-hospital mortality, mostly due to a more unfavorable risk profile and age distribution. Our study, which included many more clinical variables to adjust the mathematical model, was able to reveal the different in-hospital mortality of women with NSTEMI and STEMI, which is very important to avoid analyzing all types of MI together in the future. Compared with men, slightly higher total in-hospital mortality after MI in women may be the result of lower mortality in NSTEMI and higher mortality in STEMI.
The study design does not allow identification of the mechanisms by which mortality may be higher in women with STEMI, although it can be speculated that the different pathophysiology of coronary disease in women,28 with a greater tendency to microvascular dysfunction, in addition to clinical factors not corrected by the fit model, may have played a role.
This study has some limitations. Despite being a retrospective analysis, the use of administrative records to estimate outcomes in health services has been validated by comparing them with data from the medical records29 and has been applied to research on health service outcomes.30,31 The reliability of studies of this type enables the public comparison of hospitals in terms of outcomes.32 No detailed information was available on the extent of coronary heart disease or on the treatment followed by patients, which could limit the adjustment of the model; nevertheless, the good AUROC obtained suggests than the impact of this information would have been limited.
With respect to the adjustment models, there are confounding factors that are impossible to identify, but which may have a significant impact. The secondary diagnoses employed as risk-adjustment variables may correspond to conditions that are present on admission or to complications that, occasionally, may reflect inadequate treatment.33 Nevertheless, the models used in this study compare favorably with models published elsewhere34 in terms of their predictive capacity.
CONCLUSIONSWomen had a slight but significantly increased risk of in-hospital mortality after MI, but the effect of sex depended on MI type: women had higher mortality in STEMI and lower mortality in NSTEMI. There were also differences in other risk factors between NSTEMI and STEMI in the adjustment models for in-hospital mortality.
FUNDINGThe work was performed with an unconditional grant from Foundation Institute for Healthcare Improvement.
CONFLICTS OF INTERESTThere are no conflicts of interest.
The impact of sex on mortality in myocardial infarction has already been studied, but most studies have analyzed the impact of sex on mortality in MI overall, without distinguishing between STEMI and NSTEMI, despite the significant differences between the 2 entities with respect to pathophysiology, treatment and prognosis, all of which could be modulated by sex.
After analyzing sex differences in in-hospital mortality for STEMI and NSTEMI in 445 145 episodes of MI (2005-2015) using information of the Spanish National Health System, we observed that the effect of female sex on risk-adjustment models for in-hospital mortality differed in STEMI (OR, 1.18; 95%CI, 1.14-1.22; P <.001) and NSTEMI (OR, 0.85; 95%CI, 0.81-0.89; P <.001).