To the Editor,
We present the case of a 54-year-old patient with no history of heart disease who underwent transesophageal echocardiography (TEE) to rule out the presence of thrombus in the left atrial appendage (LAA) prior to programmed electrical cardioversion for common counterclockwise atrial flutter with 2:1 ventricular response at 150bpm.
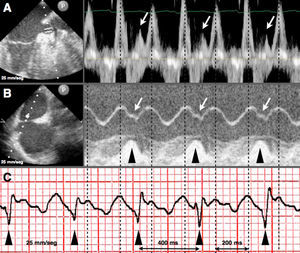
The TEE confirmed good biventricular function, no thrombus in LAA, and slight dilatation of both atria. In the mid-esophageal plane we obtained pulsed-wave Doppler echocardiograms of the LAA at 60° (Figure 1A) showing organized flow with waves 200ms apart (broken lines) and peak velocities of 0.6m/s. Rotating to 90° to visualize the interatrial septum (IAS), we obtained M-mode recordings of IAS and tricuspid annulus (Figure 1B), simultaneously visualizing the IAS swirling motion at 300bpm (atrial frequency) and tricuspid annular systolic motion (TAPSE, black triangles) at 150bpm (ventricular frequency). The lower part of the image (Figure 1C) shows a detail of ECG lead III for this patient: triangles indicate QRS at 140–150bpm; broken lines indicate F waves at 300bpm.

Figure 1. A: Transesophageal echocardiography (TEE) image (60°), pulsed Doppler of left atrial appendage flow. B: TEE (90°), M-mode images of interatrial septum and tricuspid annulus. C: ECG lead III detail.
Echocardiography is capable of diagnosing supraventricular arrhythmias from IAS or free atrium wall motion.1,2 The LAA flow velocity and organization recorded by pulsed Doppler diminish with atrial flutter. This reduction is even greater in atrial fibrillation than in sinus rhythm—facilitating diagnosis of the arrhythmia—and has been associated with states of hypercoagulability.3 Our case shows electromechanical correlation in atrial flutter and demonstrates how M-mode and pulsed Doppler echocardiography can diagnose atrial flutter. Furthermore, we discovered some physiopathological details of notes: the repercussion of ventricular contraction (black triangles, Figure 1A) on mechanical LAA contraction (note a small wave of LAA emptying: white arrowheads, Figure 1A) and the atria (note a small notch in IAS descending motion at the time of ventricular contraction, corresponding to venous pulse V wave: white arrowheads, Figure 1A).
Corresponding author: salinas.pablo@gmail.com