

The current study aimed to evaluate the causal association between hemodynamically significant stenosis and the occurrence of ischemic myocardium using an experimental animal model of coronary artery stenosis.
MethodsIn Yorkshire swine (n=10), coronary stenosis in the left anterior descending artery was induced using a customized vascular occluder to create varying degrees of occlusion severity (40%-99%). Serial changes in coronary pressure and flow velocity were measured in the left anterior descending artery before and after the implantation of the vascular occluder. At 1 month, 13N-ammonia positron emission tomography (PET) was performed, followed by the collection of isolated hearts for 2,3,5-Triphenyltetrazolium chloride (TTC) staining to quantify the percent area of necrotic myocardium. Three animals in the control group were evaluated using the same protocols, but without the implantation of a vascular occluder.
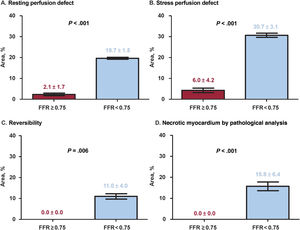
ResultsThe median diameter stenosis after vascular occluder implantation was 61.3% (Q1-Q3: 55.9%-72.3%). Significant differences were observed in hyperemic stenosis resistance, fractional flow reserve (FFR), stress perfusion defect and reversibility in PET, as well as in necrotic myocardium in TTC staining based on stenosis severity (control group: <50%, 50%-70%, 70%-90%, and >90%) (all P<.010). Animals with FFR <0.75 at 1 month exhibited a significantly higher area of stress perfusion defect (30.7±3.1% vs 6.0±4.2%, P<.001), reversibility in PET (11.0±4.0% vs 0.0±0.0%, P=.006), and necrotic myocardium in TTC staining (15.8±6.4% vs 0.0±0.0%, P<.001) than those with FFR ≥ 0.75.
ConclusionsIn a porcine model, the induction of hemodynamically significant stenosis with FFR <0.75 was associated with the development of stress perfusion defects and reversibility in PET, as well as necrotic myocardium identified by pathology.
Keywords
Ischemic cardiomyopathy, which refers to systolic dysfunction caused by chronic myocardial ischemia due to ischemic heart disease, is the most common form of heart failure. The myocardium adapts to this ischemic environment through downregulation, a process that may reverse once adequate myocardial perfusion is restored. This phenomenon is known as myocardial hibernation and serves as the basis for managing ischemic cardiomyopathy through revascularization. Recent 10-year follow-up reports from the STICH trial demonstrated improved long-term clinical outcomes after coronary bypass graft surgery compared with guideline-directed medical therapy in patients with ischemic cardiomyopathy.1
Percutaneous coronary intervention (PCI) is another commonly used treatment to revascularize significant epicardial coronary artery stenosis. Although it is widely believed that PCI improves perfusion to the ischemic myocardium and enhances clinical outcomes, recent trials have shown mixed results regarding the benefits of PCI over guideline-directed medical therapy in stable ischemic heart disease, aside from symptomatic improvement.2–4 Previous studies indicated that PCI, guided by objective evidence of myocardial ischemia, could reduce ischemic burden as shown by stress echocardiography,4 and significantly lower the incidence of cardiac death and spontaneous myocardial infarction in long-term follow-up.5 Conversely, the REVIVED-BCIS 2 trial, which compared the effects of PCI and guideline-directed medical therapy in ischemic cardiomyopathy patients with a left ventricular ejection fraction of <35% and demonstrable viable myocardial segments, found no significant difference in clinical outcomes between the 2 groups.6
Our understanding of the coronary physiological response to epicardial stenosis has primarily come from animal experiments7-9 or studies using surrogate markers of absolute myocardial blood flow, such as Doppler wire measurements of coronary flow velocity and pressure data in humans.10 However, there is no direct evidence showing how the development of hemodynamically significant epicardial coronary stenosis can lead to hibernating or infarcted myocardium. Understanding the pathophysiological mechanisms behind worsening epicardial coronary stenosis, the development of inducible myocardial ischemia, and alterations in myocardial tissue is important to understand the heterogeneous results of previous trials and adopt ischemia-directed revascularization in the treatment of patients with coronary artery disease or ischemic cardiomyopathy.
In this context, we aimed to evaluate coronary circulatory responses to varying degrees of coronary artery stenosis severity, as well as changes in myocardial perfusion. This was accomplished using a novel porcine model of artificial epicardial coronary stenosis, alongside coronary physiological assessment, myocardial perfusion evaluation via 13N-ammonia positron emission tomography (PET), and myocardial tissue staining of the harvested heart.
METHODSData from experiments will be made available after internal discussion among the first and corresponding authors upon reasonable requests.
Experimental protocols and induction of artificial stenosisThe present animal study was approved by the Ethics Committee of Chonnam National University Medical School and Chonnam National University Hospital (CNUH IACUC-21013) and conformed to the Guide for the Care and Use of Laboratory Animals published by the United States National Institutes of Health.
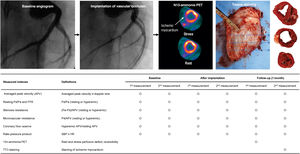
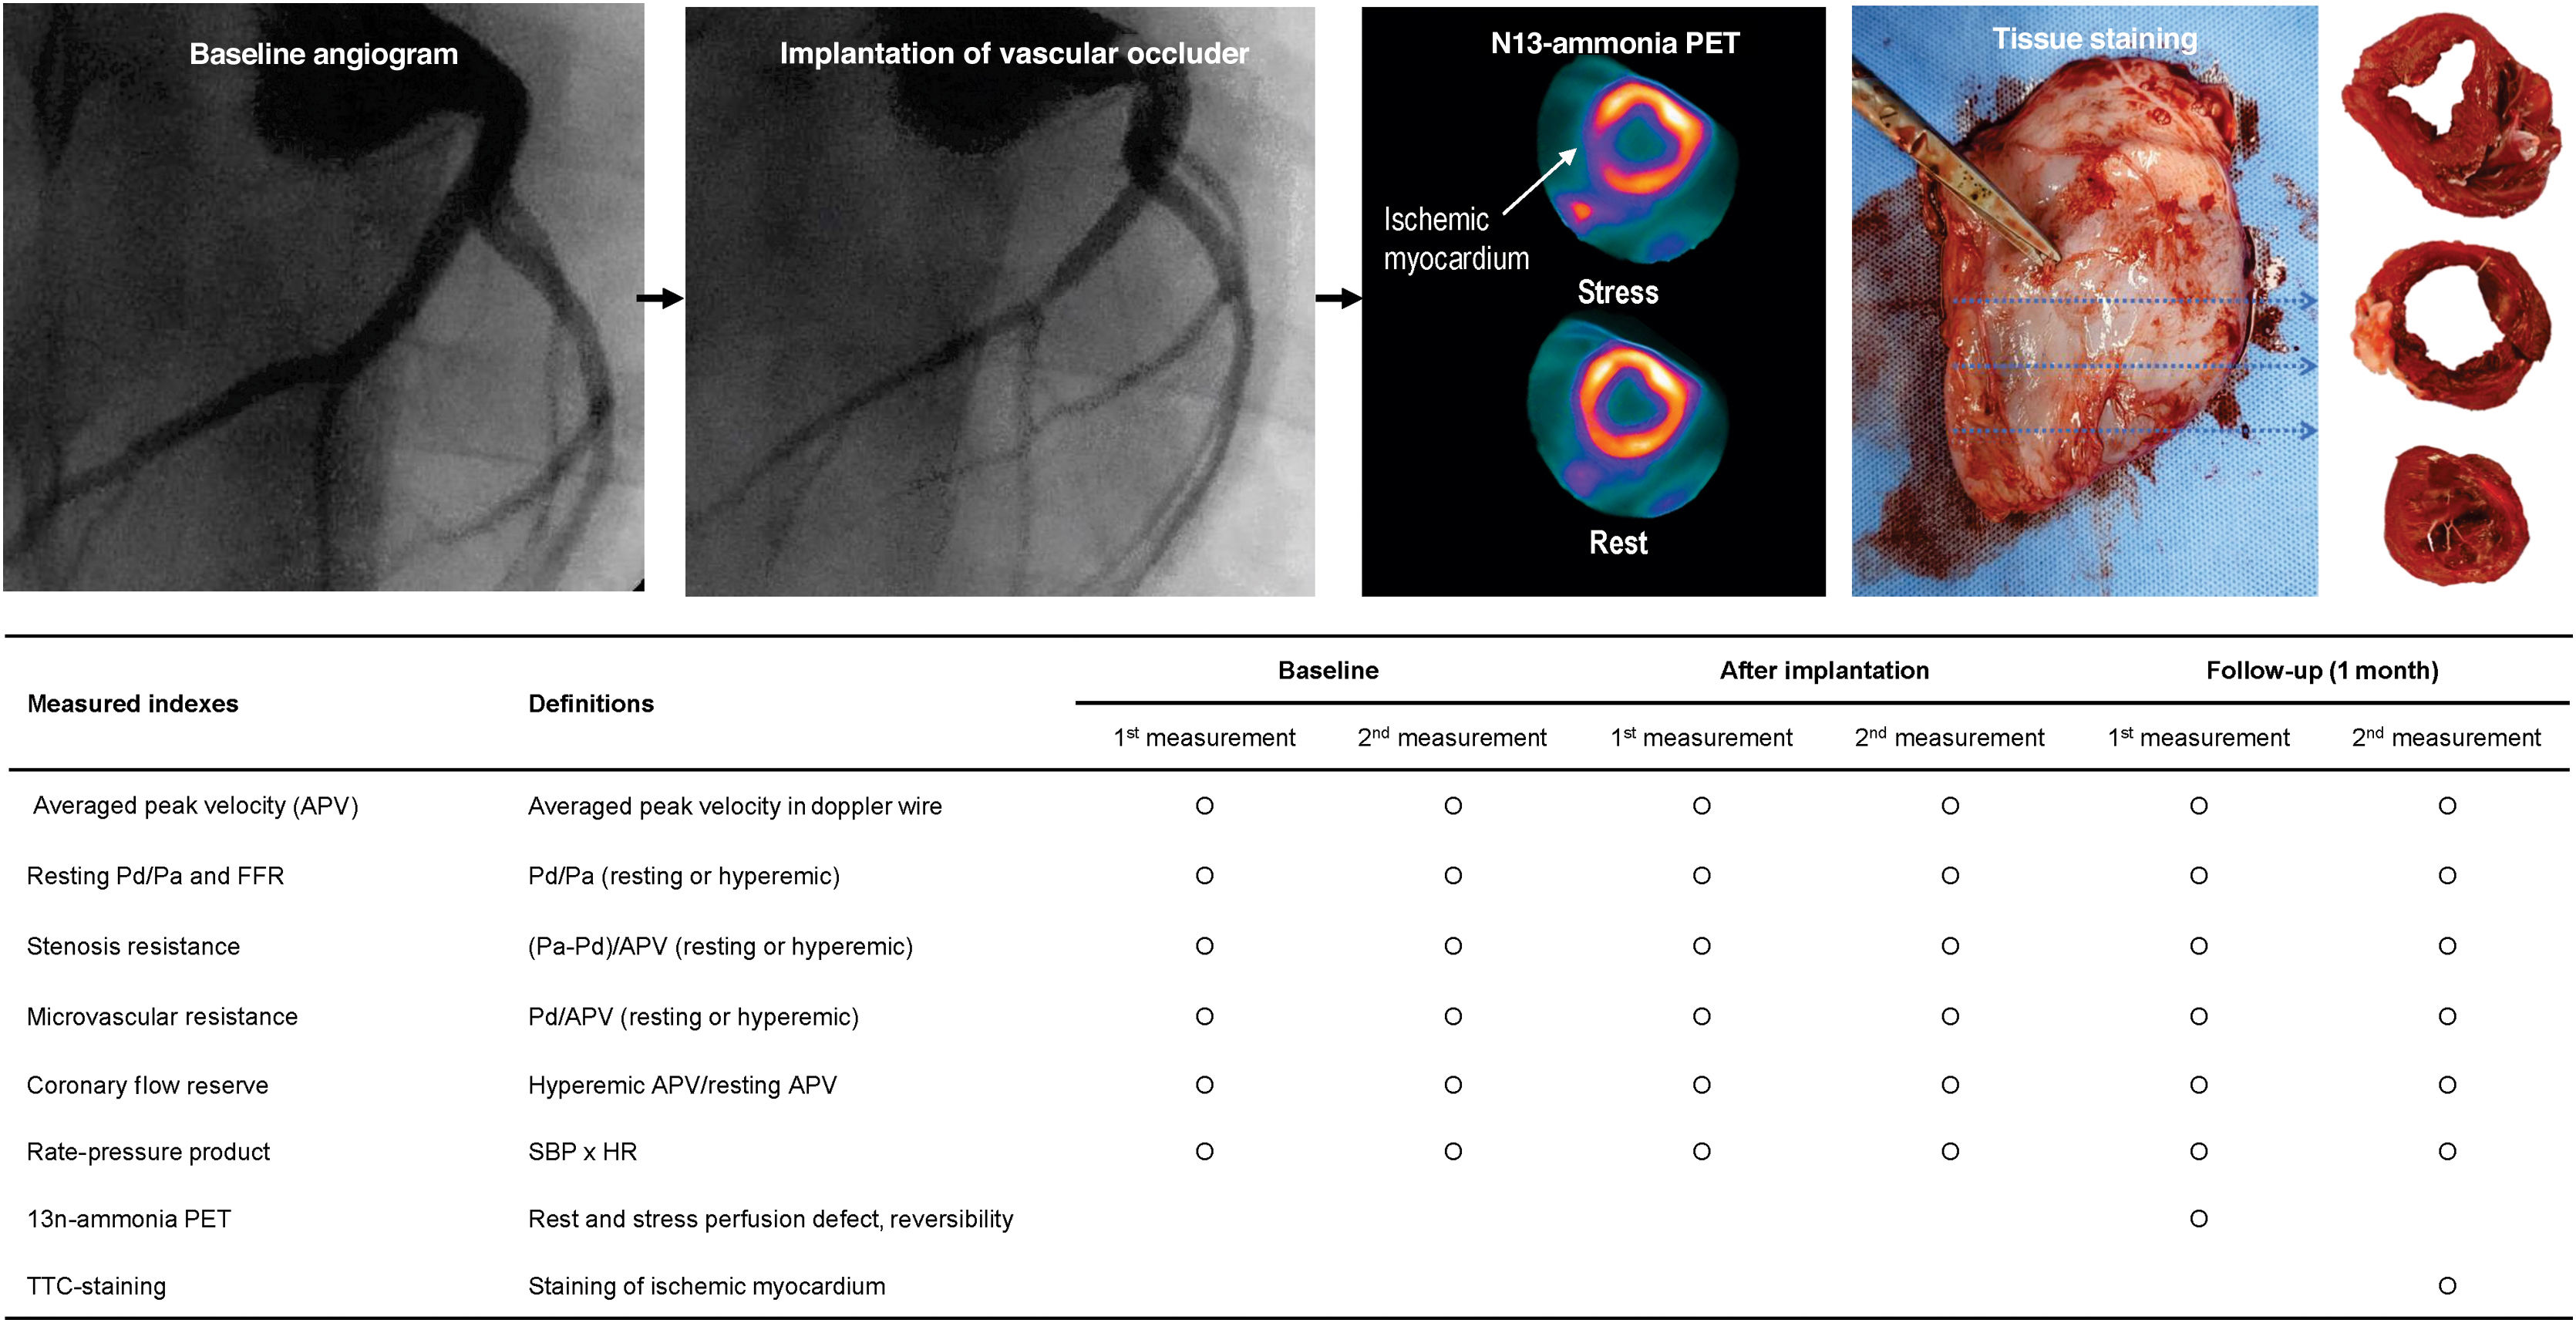
Using Yorkshire swine, the experiments consisted of 2 parts. Figure 1 summarizes the experimental protocols. First, epicardial coronary stenoses of varying degrees were created in the left anterior descending artery (LAD) by implanting a customized vascular occluder.11 Detailed methods of manufacturing the vascular occluder have been previously described.11 In brief, polycaprolactone (PCL; MW 43 000, Polyscience Inc., Taiwan, China), a Food and Drug Administration-approved, biocompatible, and biodegradable thermoplastic material, was used. A 3D-bioprinting system (3DXPrinter, T&R Biofab, Republic of Korea) equipped with multiple extrusion-based printing heads was used to extrude molten PCL through a metal needle onto a substrate in a layer-by-layer manner, producing a predesigned vascular occluder according to various reference vessel sizes (2.5mm, 2.75mm, and 3.0mm) (figure 1 of the supplementary data).

Schematic illustration of experiment protocol. After baseline angiography with the acetylcholine test, baseline coronary physiologic assessment was performed using a 0.014-inch guide wire equipped with both a pressure and Doppler flow velocity sensor (ComboWire, Philips Volcano, United States) and a pressure-sensored wire (PressureWire X Guidewire, Abbott Vascular, United States). After the implantation of the vascular occluder according to reference vessel sizes assessed by quantitative coronary angiography, the coronary physiologic assessment was repeated. Follow-up experiments were performed 1 month after the implantation of the vascular occluder. Animals underwent 13N-ammonia PET to evaluate rest and stress perfusion defects and reversibility. The day after the 13N-ammonia PET, assessment of systemic hemodynamics, coronary pressure, and Doppler-derived coronary flow velocity in the LAD was repeated, and the animals were sacrificed. The hearts were then harvested for myocardial staining with TTC to quantify the percent area of necrotic myocardium. APV, average peak velocity; FFR, fractional flow reserve; HR, heart rate; Pa, aortic pressure; Pd, distal coronary pressure; PET, positron emission tomography; SBP, systolic blood pressure; TTC, 2,3,5-Triphenyltetrazolium chloride.
After performing baseline coronary angiography and a quantitative coronary angiographic assessment of the reference vessel size of the LAD, a vascular occluder with 3 degrees of stenosis severity was implanted: 1) mild stenosis (diameter stenosis <50%) for 2 pigs; 2) intermediate stenosis (diameter stenosis 50%-70%) for 5 pigs; and 3) severe stenosis (diameter stenosis >70%) for 3 pigs. Following the implantation of the vascular occluder, coronary angiography was repeated to assess postimplantation stenosis severity via quantitative coronary angiography. Serial changes in systemic hemodynamics, coronary pressure, and Doppler-derived coronary flow velocity in the LAD were measured before and immediately after the implantation of the vascular occluder.
Second, one month after the initial experiment, the animals underwent 13N-ammonia PET to evaluate rest and stress perfusion defects and reversibility. The day after the 13N-ammonia PET, systemic hemodynamics, coronary pressure, and Doppler-derived coronary flow velocity in the LAD were reassessed, and the animals were sacrificed to harvest the heart for myocardial staining with 2,3,5-Triphenyltetrazolium chloride (TTC) to quantify the percentage area of necrotic myocardium.11
Animal preparationThe study animals were Yorkshire X Landrace F1 crossbred castrated male swine weighing 20 to 25kg. The day before the initial procedure, the animals were administered 300mg of aspirin and 180mg of ticagrelor. On the day of the procedure, the swine were anesthetized using zolazepam and tiletamine (2.5mg/kg; Zoletil 50, Virbac, Carros, France) along with xylazine (3mg/kg; Rompun, Bayer AG, Leverkusen, Germany). Anesthesia was maintained with isoflurane inhalation (1%-2%) throughout the experiment. The animals received oxygen via endotracheal intubation and normal saline intravenously during the procedure. The depth of anesthesia was clinically monitored as previously described.12,13
In the first part of the experiment, the left carotid artery was accessed using a cut-down procedure, and a 9-Fr sheath was inserted after a subcutaneous injection of 2% lidocaine. Following the engagement of the left coronary artery with a 9-Fr Judkins left guide catheter, baseline coronary angiography was conducted after the intracoronary administration of 100μg of nitroglycerin. To exclude animals with severe endothelial dysfunction, an acetylcholine test was performed. If coronary vasoconstriction was absent during acetylcholine administration, the wiring continued, and a vascular occluder was implanted in the proximal LAD using standard PCI techniques. After the implantation of the vascular occluder, aspirin (100mg) and ticagrelor (90mg twice a day) were administered until the follow-up experiment.
Follow-up experiments were conducted 1 month after the implantation of the vascular occluder. Following a subcutaneous injection of 2% lidocaine, the contralateral carotid artery was exposed using a cut-down procedure, and a 7-Fr sheath was inserted. In both experiments, ComboMap (Philips Volcano, United States) and RADI analyzer (Abbott Vascular, United States) were used to measure systemic hemodynamics, coronary pressure, and Doppler-derived coronary flow velocity in the LAD. figure 2 of the supplementary data presents the preparation of the experimental animals. In both baseline and follow-up experiments, the dimensions and ejection fraction of the left ventricle were assessed using a commercially available echocardiography system (Vivid 7, GE Medical Systems, United States) with the biplane Simpson technique
Hemodynamic and coronary physiologic measurementsDuring the experimental procedure, systemic hemodynamics were continuously monitored through systemic pressure and the rate-pressure product (systolic blood pressure in mmHg multiplied by heart rate in beats per minute), with recordings taken at each stage. Coronary physiologic evaluation was conducted using a 0.014-inch guide wire equipped with both pressure and Doppler flow velocity sensors (ComboWire, Philips Volcano, United States) in the LAD after the administration of intracoronary nitrate (100μg). The sensor tip was positioned in the mid to distal segment of the interrogated vessel. The Doppler wire was carefully manipulated circumferentially to acquire an optimal Doppler flow signal; however, the axial position of the sensor remained unchanged. Coronary flow velocity, distal coronary pressure (Pd), and aortic pressure (Pa) were simultaneously recorded under both resting and hyperemic conditions at each stage of the experiment, using a sampling rate of 200Hz with the ComboMap console. The Pa and Pd signals were also recorded simultaneously using a pressure-sensored wire (PressureWire X Guidewire, Abbott Vascular, United States). Hyperemia was induced with an intracoronary bolus of nicorandil (2mg) to avoid hypotension and heart rhythm disturbances.12,13
Mean Doppler flow velocity was averaged over a minimum of 3 consecutive heartbeats (average peak velocity [APV]). Coronary flow reserve was calculated as hyperemic APV divided by resting APV. Resting or hyperemic microvascular resistance was calculated as mean Pd divided by APV at resting or hyperemic conditions, respectively. The transstenotic pressure gradient in resting or hyperemic conditions was calculated as mean Pa minus mean Pd at those respective conditions. Basal or hyperemic stenosis resistance (hSR) was calculated as (mean Pa - mean Pd) divided by APV in resting or hyperemic conditions, respectively. Resting Pd/Pa was determined as the ratio of mean Pd to mean Pa prior to inducing hyperemia. Fractional flow reserve (FFR) was calculated as the lowest average of hyperemic Pd/Pa during 3 consecutive beats at maximal hyperemia. After the measurements, the guide wire was retracted to the guiding catheter, and the presence of drift was checked. At each stage of the experiment, 5 repeated measurements were acquired at 5-minute intervals.
13N-ammonia PET protocols and tissue stainingThe animals fasted for ≥ 4hours prior to the 13N-ammonia PET study. All PET images were acquired at baseline and in a hyperemic state using a dedicated PET/CT scanner (Discovery ST, GE Healthcare, United States). First, a low-dose computed tomography scan was obtained for attenuation correction before the dynamic PET acquisition. A bolus of 13N-ammonia (370 MBq) was then injected via a peripheral vein using an automatic injector. Simultaneous dynamic acquisition of resting PET images was initiated and lasted for 10minutes in a 3-dimensional list mode. Immediately after the resting image acquisition, intravenous adenosine (140μg/kg/min) was continuously infused for 6minutes, and the stress dose of 13N-ammonia (370 MBq) was injected at peak stress for 3minutes. Dynamic stress PET images were acquired following the same protocols used for resting PET images described above. Images were retrospectively framed as suggested by Slomka et al.,14 and the last 7-minute frames were used to reconstruct static perfusion images. Perfusion image reconstruction and analyses were performed using dedicated nuclear cardiology software packages (QGS/QPS, version 2008, Cedar-Sinai Medical Center, Los Angeles, CA; Emory Cardiac Toolbox, version 4.2, Syntermed, Atlanta, GA). The percent areas of resting and stress perfusion defects in the left ventricular (LV) myocardium were measured on 2-dimensional polar plots. Reversibility was calculated as (percent area stress perfusion defect – percent area resting perfusion defect), serving as a representative marker of ischemic myocardium.
After completion of the experiment, all study animals were euthanized using potassium chloride injection, in accordance with the Guide for the Care and Use of Laboratory Animals. The isolated hearts were vertically sliced from the apex to the LV in 2cm thick sections. The tissue sections were then incubated in 1% TTC diluted in phosphate-buffered saline (PBS) (pH 7.4) for 15minutes at 37°C. The TTC-positive area was defined as the necrotic myocardial area. The size of the necrotic myocardial area was manually measured using ImageJ (version 1.48v; National Institutes of Health, Bethesda, MD, United States) for each slice, and the average value was expressed as a percentage of the LV surface area.
Control animals underwent the same experimental protocols, including vascular access, coronary angiography, hemodynamic and coronary physiological assessment, 13N-ammonia PET, and TTC staining of myocardial tissue, but without the implantation of a vascular occluder.
None of the animals died during the experiments; however, 3 animals died before the 1-month follow-up could be performed. The causes of death for these 3 animals were sudden cardiac death due to thrombotic total occlusion of the vascular occluder (occluder stenosis severity: 70% to 90%; time to death: 1 day after the initial experiment), unidentified infection (occluder stenosis severity: 50% to 70%; 12 days after the initial experiment), and unexplained death with no significant abnormal findings in the target vessel (occluder stenosis severity: <50%; 10 days after the initial experiment), respectively. These animals could not undergo the 1-month follow-up experiments involving invasive physiology and 13N-ammonia PET; however, pathologic evaluation of TTC staining of myocardial tissue was performed on the harvested hearts.
Statistical analysisContinuous values are expressed as medians with first and third quartiles (Q1 and Q3). The correlation between the 2 variables was represented by the Spearman correlation coefficient. To compare hemodynamic and physiological indexes, a generalized estimating equation with an independent correlation structure was used to account for intra-subject variability in repeatedly measured and clustered data. Estimated means and 95% standard errors were presented as summary statistics (estimated mean±standard error). Temporal changes in resting and hyperemic indexes were illustrated using line graphs or box-and-whisker plots. Differences in percent resting and stress perfusion defect, reversibility in 13N-ammonia PET, and percent area of necrotic myocardium between the 2 groups classified according to FFR during follow-up experiments were tested using a generalized estimating equation model and were illustrated as box-and-whisker plots. All analyses were two-tailed, and statistical significance was defined as P<.05. All statistical analyses were conducted using R version 4.3.2 (R Foundation for Statistical Computing, Vienna, Austria) and SPSS 25.0 for Windows (SPSS-PC, Chicago, IL, United States).
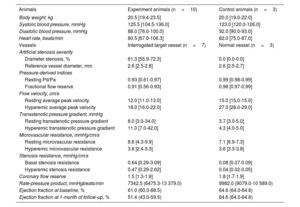
RESULTSBaseline characteristics of experimental and control animalsTable 1 summarizes the general characteristics of experimental animals (n=10) and normal control animals (n=3). The median body weight of experimental and control animals was 20.5kg (19.4-23.5kg) and 20.0kg (19.0-22.0kg), respectively. The median systolic and diastolic blood pressures, as well as baseline heart rates, were similar between the experimental and control animals. Among the experimental animals who underwent follow-up one month after the implantation of the vascular occluder, the stenosis severity of target vessels ranged from moderate to severe, with a median diameter stenosis of 61.3% (55.9-72.3%), resting Pd/Pa of 0.93 (0.61-0.97), and FFR of 0.91 (0.56-0.93). Coronary flow reserve in the target vessel was 1.5 (1.3-1.8), and hyperemic microvascular resistance was 3.8mmHg/cm/s (2.4-5.3mmHg/cm/s). In the experimental animals, stenosis severity of target vessels showed a significant correlation with resting Pd/Pa (rho=−0.745, P=.033), FFR (rho=-0.645, P=.049), hSR (rho=0.797, P=.032), and transstenotic pressure gradient (rho=−0.734, P=.048). Conversely, there was no epicardial coronary stenosis in the normal control animals, with resting Pd/Pa of 0.99 (0.98-0.99) and FFR of 0.98 (0.97-0.99). In both groups, the baseline median left ventricular ejection fraction was within the normal range. In the experimental group, the left ventricular ejection fraction significantly decreased from baseline to the 1-month follow-up (median left ventricular ejection fraction 61.0% at baseline vs 51.4% at 1-month follow-up, P=.013).
General characteristics of experiment animals and interrogated target vessel findings at 1 month of follow-up
| Animals | Experiment animals (n=10) | Control animals (n=3) |
|---|---|---|
| Body weight, kg | 20.5 [19.4-23.5] | 20.0 [19.0-22.0] |
| Systolic blood pressure, mmHg | 125.5 [104.5-136.0] | 123.0 [120.0-126.0] |
| Diastolic blood pressure, mmHg | 88.0 [76.0-100.0] | 92.0 [90.0-93.0] |
| Heart rate, beats/min | 80.5 [67.0-106.3] | 82.0 [75.0-87.0] |
| Vessels | Interrogated target vessel (n=7) | Normal vessel (n=3) |
| Artificial stenosis severity | ||
| Diameter stenosis, % | 61.3 [55.9-72.3] | 0.0 [0.0-0.0] |
| Reference vessel diameter, mm | 2.6 [2.5-2.8] | 2.6 [2.5-2.7] |
| Pressure-derived indices | ||
| Resting Pd/Pa | 0.93 [0.61-0.97] | 0.99 [0.98-0.99] |
| Fractional flow reserve | 0.91 [0.56-0.93] | 0.98 [0.97-0.99] |
| Flow velocity, cm/s | ||
| Resting average peak velocity | 12.0 [11.0-13.0] | 15.0 [15.0-15.0] |
| Hyperemic average peak velocity | 18.0 [16.0-22.0] | 27.0 [26.0-29.0] |
| Transstenotic pressure gradient, mmHg | ||
| Resting transstenotic pressure gradient | 8.0 [3.0-34.0] | 3.7 [3.0-5.0] |
| Hyperemic transstenotic pressure gradient | 11.0 [7.0-42.0] | 4.3 [4.0-5.0] |
| Microvascular resistance, mmHg/cm/s | ||
| Resting microvascular resistance | 8.6 [4.3-9.9] | 7.1 [6.9-7.3] |
| Hyperemic microvascular resistance | 3.8 [2.4-5.3] | 3.6 [3.3-3.8] |
| Stenosis resistance, mmHg/cm/s | ||
| Basal stenosis resistance | 0.64 [0.29-3.09] | 0.08 [0.07-0.09] |
| Hyperemic stenosis resistance | 0.47 [0.29-2.62] | 0.04 [0.02-0.05] |
| Coronary flow reserve | 1.5 [1.3-1.8] | 1.8 [1.7-1.9] |
| Rate-pressure product, mmHgbeats/min | 7342.5 (6475.3-13 379.0) | 9982.0 (9079.0-10 589.0) |
| Ejection fraction at baseline, % | 61.0 (60.0-68.5) | 64.6 (64.0-64.6) |
| Ejection fraction at 1-month of follow-up, % | 51.4 (43.0-59.5) | 64.6 (64.0-64.6) |
Pa, aortic pressure; Pd, distal coronary pressure.
Values are expressed as median [interquartile ranges, 25th-75th].
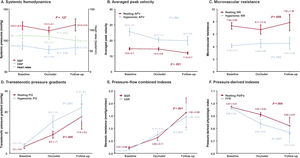
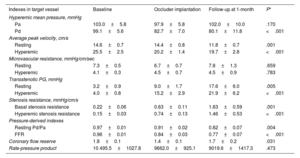
Table 2 and figure 2 present changes in coronary circulatory indexes before, immediately after, and 1 month after vascular occluder implantation. Systemic hemodynamics, rate-pressure product, and microvascular resistance were not influenced by the implantation of the vascular occluder or epicardial coronary stenosis (table 2 and figure 2). In contrast, both resting and hyperemic APV significantly decreased after the implantation of the vascular occluder, along with an increased transstenotic pressure gradient. Indices of physiological stenosis severity, including hSR, resting Pd/Pa, and FFR, also changed significantly (all P values <.010) (table 2 and figure 2). While coronary flow reserve measured immediately after vascular occluder implantation decreased from baseline, it returned to baseline levels at the 1-month follow-up.
Changes in coronary circulatory indexes in target vessel at baseline, implantation of occluder, and 1 month of follow-up
| Indexes in target vessel | Baseline | Occluder implantation | Follow-up at 1-month | P* |
|---|---|---|---|---|
| Hyperemic mean pressure, mmHg | ||||
| Pa | 103.0±5.8 | 97.9±5.8 | 102.0±10.0 | .170 |
| Pd | 99.1±5.6 | 82.7±7.0 | 80.1±11.8 | <.001 |
| Average peak velocity, cm/s | ||||
| Resting | 14.6±0.7 | 14.4±0.8 | 11.8±0.7 | .001 |
| Hyperemic | 25.5±2.5 | 20.2±1.4 | 19.7±2.8 | <.001 |
| Microvascular resistance, mmHg/cm/sec | ||||
| Resting | 7.3±0.5 | 6.7±0.7 | 7.8±1.3 | .659 |
| Hyperemic | 4.1±0.3 | 4.5±0.7 | 4.5±0.9 | .783 |
| Transstenotic PG, mmHg | ||||
| Resting | 3.2±0.9 | 9.0±1.7 | 17.6±6.0 | .005 |
| Hyperemic | 4.0±0.8 | 15.2±2.9 | 21.9±6.2 | <.001 |
| Stenosis resistance, mmHg/cm/s | ||||
| Basal stenosis resistance | 0.22±0.06 | 0.63±0.11 | 1.63±0.59 | .001 |
| Hyperemic stenosis resistance | 0.15±0.03 | 0.74±0.13 | 1.46±0.53 | <.001 |
| Pressure-derived indexes | ||||
| Resting Pd/Pa | 0.97±0.01 | 0.91±0.02 | 0.82±0.07 | .004 |
| FFR | 0.96±0.01 | 0.84±0.03 | 0.77±0.07 | <.001 |
| Coronary flow reserve | 1.8±0.1 | 1.4±0.1 | 1.7±0.2 | .031 |
| Rate-pressure product | 10 495.5±1027.8 | 9662.0±925.1 | 9019.6±1417.3 | .473 |
FFR, fractional flow reserve; Pa, aortic pressure; Pd, distal coronary pressure; PG, pressure gradient.
The data are presented as estimated mean and 95% standard error (estimated mean±standard error), calculated using generalized estimating equation.

Changes in coronary circulatory indexes in the target vessel at baseline, implantation of the occluder, and 1-month follow-up. Changes in (A) systemic hemodynamics, (B) average peak velocity, (C) microvascular resistance, (D) transstenotic pressure gradients, (E) pressure-flow combined indexes, and (F) pressure-derived indexes are demonstrated according to the experimental process, including baseline, immediately after the implantation of the vascular occluder, and at 1-month follow-up. Red and blue circles represent means of coronary circulatory indexes, and error bars represent 95% standard errors. APV, average peak velocity; BSR, basal stenosis resistance; DBP, diastolic blood pressure; FFR, fractional flow reserve; hSR, hyperemic stenosis resistance; MR, microvascular resistance; PG, transstenotic pressure gradients; SBP, systolic blood pressure.
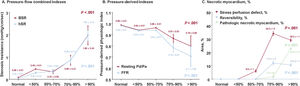
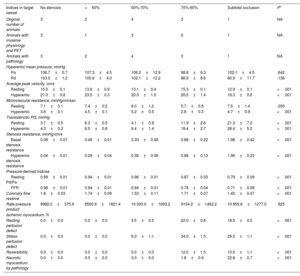
When changes in coronary circulatory indexes were evaluated according to stenosis severity, there were no marked changes in diameter stenosis for the <50% and 50% to 70% groups. Transstenotic pressure gradient and hSR increased in the 70% to 90% diameter stenosis group. Similarly, resting Pd/Pa and FFR decreased in the 70-90% diameter stenosis group (all P values <.001) (table 3 and figure 3). PET-derived stress perfusion defect gradually increased from the 50% to 70% diameter stenosis group, peaking in the 70% to 90% group. When diameter stenosis exceeded 90%, PET-derived stress perfusion defect and reversibility slightly decreased, accompanied by a significant increase in the TTC-positive area in this group (table 3 and figure 3).
Comparison of coronary circulatory indexes in target vessel and proportion of ischemic myocardium by 13N-ammonia PET or necrotic myocardium by pathologic evaluation according to stenosis severity at 1 month of follow-up
| Indices in target vessel | No stenosis | <50% | 50%-70% | 70%-90% | Subtotal occlusion | P* |
|---|---|---|---|---|---|---|
| Original number of animals | 3 | 2 | 4 | 3 | 1 | NA |
| Animals with invasive physiology and PET | 3 | 1 | 3 | 2 | 1 | NA |
| Animals with pathology | 3 | 2 | 4 | 3 | 1 | NA |
| Hyperemic mean pressure, mmHg | ||||||
| Pa | 106.7±0.7 | 107.3±4.5 | 106.2±12.9 | 98.8±6.3 | 102.1±4.5 | .642 |
| Pd | 103.0±1.2 | 100.9±4.0 | 102.1±12.2 | 86.9±8.6 | 80.9±11.7 | .136 |
| Average peak velocity, cm/s | ||||||
| Resting | 15.0±0.1 | 13.8±0.9 | 13.1±0.4 | 15.3±0.1 | 12.9±0.1 | <.001 |
| Hyperemic | 27.0±0.8 | 23.5±0.3 | 20.0±1.0 | 26.5±1.4 | 18.3±0.6 | <.001 |
| Microvascular resistance, mmHg/cm/sec | ||||||
| Resting | 7.1±0.1 | 7.4±0.2 | 8.0±1.2 | 5.7±0.6 | 7.5±1.4 | .055 |
| Hyperemic | 3.6±0.1 | 4.5±0.1 | 5.2±0.5 | 2.8±0.3 | 4.7±0.9 | <.001 |
| Transstenotic PG, mmHg | ||||||
| Resting | 3.7±0.5 | 6.3±0.5 | 4.1±0.9 | 11.9±2.6 | 21.3±7.2 | <.001 |
| Hyperemic | 4.3±0.3 | 6.5±0.6 | 6.4±1.4 | 18.4±2.7 | 28.4±5.2 | <.001 |
| Stenosis resistance, mmHg/cm/s | ||||||
| Basal stenosis resistance | 0.08±0.01 | 0.46±0.01 | 0.33±0.08 | 0.86±0.22 | 1.98±0.42 | <.001 |
| Hyperemic stenosis resistance | 0.04±0.01 | 0.29±0.04 | 0.36±0.08 | 0.86±0.13 | 1.96±0.23 | <.001 |
| Pressure-derived indices | ||||||
| Resting Pd/Pa | 0.99±0.01 | 0.94±0.01 | 0.96±0.01 | 0.87±0.03 | 0.79±0.09 | <.001 |
| FFR | 0.98±0.01 | 0.94±0.01 | 0.94±0.01 | 0.78±0.04 | 0.71±0.09 | <.001 |
| Coronary flow reserve | 1.8±0.03 | 1.74±0.09 | 1.53±0.11 | 1.71±0.07 | 1.45±0.07 | <.001 |
| Rate-pressure product | 9982.0±375.9 | 9500.9±1821.4 | 10 005.0±1693.2 | 9104.2±1462.2 | 10 855.6±1277.0 | .925 |
| Ischemic myocardium, % | ||||||
| Resting perfusion defect | 0.0±0.0 | 0.0±0.0 | 3.5±0.5 | 22.0±0.8 | 18.5±0.5 | <.001 |
| Stress perfusion defect | 0.0±0.0 | 0.0±0.0 | 6.0±1.1 | 34.0±1.5 | 29.0±1.1 | <.001 |
| Reversibility | 0.0±0.0 | 0.0±0.0 | 0.0±0.0 | 12.0±1.5 | 10.5±1.1 | <.001 |
| Necrotic myocardium by pathology | 0.0±0.0 | 0.0±0.0 | 0.0±0.0 | 1.8±0.9 | 22.8±0.7 | <.001 |
FFR, fractional flow reserve; Pa, aortic pressure; Pd, distal coronary pressure; PET, positron emission tomography; PG, pressure gradient.
The data are presented as estimated mean and 95% standard error (estimated mean±standard error), calculated using generalized estimating equation.

Comparison of coronary physiologic indexes, PET-derived myocardial ischemic indexes, and proportion of necrotic myocardium by pathologic evaluation according to stenosis severity. Changes in (A) pressure-flow combined indexes, (B) pressure-derived indexes, and (C) percent necrotic myocardium by 13N-ammonia PET or pathology are demonstrated according to stenosis severity. BSR, basal stenosis resistance; FFR, fractional flow reserve; hSR, hyperemic stenosis resistance; Pa, aortic pressure; Pd, distal coronary pressure.
When the experimental animals were classified according to FFR, animals with FFR <0.75 showed significantly higher PET-derived resting and stress perfusion defect areas, as well as areas of reversibility, than those with FFR ≥0.75. The TTC-positive necrotic myocardial area was also significantly higher in animals with FFR <0.75 compared with those with FFR ≥0.75 (table 4 and figure 4).
Comparison of proportion of ischemic myocardium by 13N-ammonia PET or necrotic myocardium by pathologic evaluation, according to FFR at 1 month of follow-up
| Ischemic myocardium, % | FFR≥0.75(animals n=7) | FFR <0.75(animals n=3) | P* |
|---|---|---|---|
| Resting perfusion defect | 2.1±1.7 | 19.7±1.5 | <.001 |
| Stress perfusion defect | 6.0±4.2 | 30.7±3.1 | <.001 |
| Reversibility | 0.0±0.0 | 11.0±4.0 | .006 |
| Necrotic myocardium by pathology | 0.0±0.0 | 15.8±6.4 | <.001 |
FFR, fractional flow reserve; PET, positron emission tomography.
The data are presented as estimated mean and 95% standard error (estimated mean±standard error), calculated using generalized estimating equation.

Comparison of PET-derived myocardial ischemic indexes and proportion of necrotic myocardium by pathologic evaluation, according to FFR at 1-month follow-up. Comparisons of (A) resting perfusion defect, (B) stress perfusion defect, (C) reversibility in 13N-ammonia PET, and (D) percent necrotic myocardium by pathologic evaluation are presented with box plots between FFR≥0.75 vs FFR <0.75 groups. Mean and 95% standard errors are presented in box plots. FFR, fractional flow reserve; PET, positron emission tomography.
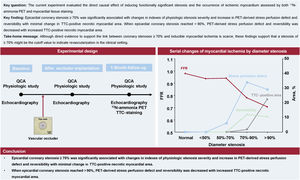
The current experiment evaluated the direct causal effect of inducing functionally significant stenosis and the occurrence of ischemic myocardium assessed by both 13N-ammonia PET and myocardial tissue staining. The main findings are as follows. First, implantation of the customized vascular occluder induced various degrees of epicardial coronary stenosis in a controlled manner without significant alteration in systemic hemodynamics and microvascular resistance. Indexes of physiologic stenosis severity including hSR, resting Pd/Pa, and FFR showed significant changes when diameter stenosis reached 70%-90%. Second, 13N-ammonia PET showed an increase in stress perfusion defects and reversibility when diameter stenosis reached 70-90% with minimal change of TTC-positive necrotic myocardial area. Third, however, PET-derived stress perfusion defects and reversibility decreased when the diameter stenosis was over 90%, with increased TTC-positive necrotic myocardial area. These results demonstrate that the treatment effect of coronary revascularization to restore myocardial perfusion would potentially be highest in epicardial coronary stenoses of 70%-90%. However, the treatment effect would be decreased in >90% epicardial coronary stenoses, even with only 1-month duration of myocardial ischemia (figure 5).

Central illustration. Experimental validation of coronary stenoses and development of ischemic myocardium. The current experiment evaluated the direct causal effect of inducing functionally significant stenosis and the occurrence of ischemic myocardium assessed by both 13N-ammonia PET and myocardial tissue staining. Epicardial coronary stenosis ≥70% was significantly associated with changes in indexes of physiologic stenosis severity and an increase in PET-derived stress perfusion defect and reversibility with minimal change in TTC-positive necrotic myocardial area. When epicardial coronary stenosis reached >90%, PET-derived stress perfusion defect and reversibility were decreased with increased TTC-positive necrotic myocardial area. FFR, fractional flow reserve; QCA, quantitative coronary angiography; TTC, 2,3,5-Triphenyltetrazolium chloride; PET, positron emission tomography.
Traditionally, significant coronary disease was defined as coronary stenosis of ≥50%, based on early study findings that coronary vasodilator reserve begins to decline when the stenosis was about 40%-50%.15 Currently, diameter stenosis of ≥70% for non-left main disease and ≥50% for left main disease have been defined as significant stenoses to be revascularized based on angiographic assessment by current guidelines.16,17 For an intermediate stenosis with diameter stenosis of 50-70%, the current guidelines have recommended additional investigation, such as FFR, for securing objective evidence of myocardial ischemia, especially for patients in stable settings.16,17 The theoretical background of functional testing for epicardial coronary stenosis was based on 2 landmark studies. Gould et al.7 reported a causal relationship between coronary flow and epicardial coronary stenosis, and for diameter stenosis >50%, the hyperemic coronary flow began to decrease, whereas resting coronary flow began to decrease when diameter stenosis was >80%. After the experimental model of FFR was validated,18 FFR <0.75 was designated as cut-off value by multiple non-invasive functional tests.19 In contemporary practice, visually estimated diameter stenosis of ≥70% or functionally significant stenosis by FFR have been considered as indicators for revascularization in contemporary practice. However, direct evidence to support the link between coronary stenoses ≥70% and inducible myocardial ischemia is scarce.
The current experimental model provides insight into the impact of epicardial coronary stenosis in terms of inducible myocardial ischemia, reversibility, and pathologic changes of ischemic myocardium by systematic evaluation with pressure-flow-related indexes, 13N-ammonia PET, and pathologic findings after implantation of occluders. By using vascular occluders with controlled stenosis severity, we were able to correlate and compare various degrees of coronary stenosis with different hemodynamic and pathologic outcomes. Of note, both the pressure-flow combined, and pressure-derived indexes were shown to significantly worsen in stenoses ≥70%. Coupled with the findings from PET and pathology where stress perfusion defects and reversibility in PET developed, and TTC positive area began to be detected in stenoses ≥70%, it can be assumed that pathologic changes to the myocardium begin when the stenosis reaches 70%. Interestingly, in diameter stenosis greater than 90%, both stress perfusion defects and reversibility were decreased, and TTC positive area was increased. These findings support that the stenosis of ≥70% might be the cutoff value to indicate revascularization in the clinical setting. It should be noted that 50-70% stenoses were observed to cause minimal changes in physiologic indexes and pathologic findings of myocardial tissue. This finding provides evidence that medical treatment is noninferior to revascularization for angiographically intermediate stenosis or stenosis with gray zone FFR with preserved coronary flow reserve.20
When stress perfusion defects, reversibility, and TTC positive area were compared according to FFR <0.75 versus FFR≥0.75, this study confirmed the impact of FFR <0.75 by demonstrating increased stress perfusion defects and reversibility from PET and area of necrotic myocardium by pathology. These results support the current guidelines and clinical practice of revascularization for stenoses with low FFR.
Ischemic myocardium and clinical implications to ischemic cardiomyopathyThe central phenomenon causing ischemic cardiomyopathy is myocardial hibernation, reversible downregulation of myocardial function caused by chronic inadequate myocardial perfusion. Based on our study, a coronary stenosis of ≥70% or FFR <0.75 may cause myocardial ischemia that may lead to myocardial hibernation, which might be reversed if the stenosis is resolved. Therefore, the present findings imply that ischemia-directed revascularization can be beneficial in restoring cardiac function and improving clinical outcomes, in concordance with previous trials with PCI and CABG on ischemic cardiomyopathy patients.1,4,5
Interestingly, PET findings in the area supplied by the coronary artery with stenosis of >90% show that stress perfusion defects and reversibility slightly decrease while pathology shows area of necrotic myocardium increases compared to stenosis of 70%-90%. This implies irreversible changes in the myocardium occur even if the artery is not completely occluded, though it may still appear as reversible area in the imaging studies. Based on this finding, one can assume that revascularization for ischemic cardiomyopathy can have a limited effect if near total or total occlusions are present in the coronary arteries. Though viability tests have been done to ensure reversibility in treated areas, irreversible changes may be present to a greater extent than assumed from imaging studies. This may explain conflicting results from previous trials on revascularization by PCI for ischemic cardiomyopathy,1,6 and recent prespecified analysis of REVIVED-BCIS 2 trial, which demonstrated that the extent of non-viable myocardium has a greater influence on prognosis after revascularization, rather than the extent of viable myocardium.21
Our findings suggest that the selection of optimal targets for revascularization would be crucial for improving clinical outcomes of ischemic cardiomyopathy, and support that the assessment of non-viable myocardium might be the key to differentiate the responder versus non-responder for coronary revascularization by PCI in patients with ischemic cardiomyopathy. Further studies are warranted to clarify the clinical usefulness of current non-invasive imaging modalities to assess pathologic changes in ischemic myocardium and its impact on patient prognosis after coronary revascularization by PCI. In addition, currently ongoing Revascularization Versus Medical Treatment in Patients With Ischemic Left Ventricular Dysfunction (RESTORE-PCI, NCT05828719) would provide additional insights on the clinical benefits of ischemia-directed PCI on ischemic cardiomyopathy.
LimitationsSome limitations should be acknowledged. First, as the vascular occluders only represent epicardial stenosis, and no significant change in microvascular resistance was found in this study, the impact of microvascular dysfunction could not be evaluated. Second, dual staining with Evan's blue and TTC is a commonly used protocol for evaluating reversible and irreversible changes in ischemic myocardium. In the current study, the reversibility of ischemic myocardium was planned to be evaluated by 13N-ammonia PET, and only TTC staining was performed to assess pathologic changes in ischemic myocardium. Therefore, pathologic evidence of reversible ischemic myocardium could not be assessed. Third, since the vascular occluder could not be removed after implantation, hemodynamic and pathologic effects of revascularization for epicardial coronary stenosis could not be evaluated. Fourth, the method of implanting vascular occluder percutaneously has not been well studied compared with the traditional surgical approach and application of hydraulic vascular occluder.22
CONCLUSIONSIn a porcine model of coronary artery stenosis, induction of hemodynamically significant stenosis with FFR <0.75 was significantly associated with development of stress perfusion defect and reversibility in PET as well as necrotic myocardium by pathology. The current experiment suggests the direct link between inducible myocardial ischemia and development of necrotic myocardium and supports an ischemia-directed revascularization strategy for patients with ischemic cardiomyopathy.
- -
A direct causal association among epicardial coronary stenosis, inducible myocardial ischemia, and the development of ischemic myocardium has not been validated by pathologic evaluation.
- -
The current experiment evaluated the direct causal effect of inducing functionally significant stenosis and on the occurrence of ischemic myocardium assessed by both 13N-ammonia PET and myocardial tissue staining.
- -
Epicardial coronary stenosis of ≥70% was significantly associated with changes in indexes of physiological stenosis severity, an increase in PET-derived stress perfusion defect, and reversibility, with minimal change in the TTC-positive necrotic myocardial area.
- -
When epicardial coronary stenosis exceeded 90%, PET-derived stress perfusion defect and reversibility decreased, while the area of TTC-positive necrotic myocardium increased.
- -
Although direct evidence supporting the link between coronary stenoses of ≥70% and inducible myocardial ischemia is scarce, these findings suggest that a stenosis of ≥70% may serve as a cutoff value for indicating revascularization in the clinical setting.
- -
The current results indicate that coronary artery stenosis of >90% is associated with decreased stress perfusion defect and reversibility, along with an increased area of necrotic myocardium on pathology compared with stenosis of 70% to 90%. This implies that irreversible changes in the myocardium can occur even when the artery is not completely occluded, although it may still appear as a reversible area in imaging studies.
This study was supported by grants from Chong Kun Dang, the Korean Health Technology R&D Project through the Korea Health Industry Development Institute (KHIDI), funded by the Ministry of Health & Welfare, Republic of Korea (RS-2023-00302146 and RS-2023-00302153), the Korea Research Institute of Bioscience and Biotechnology (KRIBB) Research Initiative Program (KGM4252021), and an unrestricted research grant from the Korean Society of Interventional Cardiology (PHO0221891). The funder had no role in the study design, conduct, data analysis, or manuscript preparation.
ETHICAL CONSIDERATIONSThe study was approved by the Ethics Committee of Chonnam National University Medical School and Chonnam National University Hospital (CNUH IACUC-21013) and conformed to the Guide for the Care and Use of Laboratory Animals published by the United States National Institutes of Health. This is a translational research article with no sex/gender bias.
STATEMENT ON THE USE OF ARTIFICIAL INTELLIGENCENo artificial intelligence was used in the preparation of this manuscript.
AUTHORS’ CONTRIBUTIONSJ.M. Lee, S.H. Lee, and W. Kwon contributed equally as the first authors. The authors confirm their contributions to the paper as follows: study conception and design: J.M. Lee, S.H. Lee, Y.J. Hong; data collection: J.M. Lee, S.H. Lee, W. Kwon, H.B. Kim, D. Hong, H.K. Kim, S.G. Cho, D. Shin, K.S. Park, J. Kim, J.B. Moon, H-.C. Song, S. Lee, D-.H. Ha, J. Jang; analysis and interpretation of the results: J.M. Lee, S.H. Lee, Y.J. Hong; draft manuscript preparation: J.M. Lee, S.H. Lee, Y.J. Hong; critically revising it for important intellectual content: Y. Ahn, M.H. Jeong, K.H. Choi, T.K. Park, J.H. Yang, Y.B. Song, J-.Y. Hahn, S-.H. Choi, H-.C. Gwon. All authors reviewed the results and approved the final version of the manuscript.
CONFLICTS OF INTERESTJ.M. Lee received an Institutional Research Grant from Abbott Vascular, Boston Scientific, Philips Volcano, Terumo Corporation, Zoll Medical, Donga-ST, the Korean Society of Interventional Cardiology, and Yuhan Pharmaceutical. S.H. Lee received an Institutional Research Grant from Abbott Vascular and the Korean Cardiac Research Foundation. J.-Y. Hahn received an Institutional Research Grant from the National Evidence-based Healthcare Collaborating Agency, the Ministry of Health & Welfare, Korea, Abbott Vascular, Biosensors, Boston Scientific, Daiichi Sankyo, Donga-ST, Hanmi Pharmaceutical, and Medtronic Inc. H.-C. Gwon received an Institutional Research Grant from Boston Scientific, Genoss, and Medtronic Inc. Y.J. Hong received an Institutional Research Grant from Abbott Vascular, Boston Scientific, Biosensors, and MicroPort. All other authors declare that there are no competing interests to declare.