Little is known about the impact of networks for ST-segment elevation myocardial infarction (STEMI) care on the population. The objective of this study was to determine whether the PROGALIAM (Programa Gallego de Atención al Infarto Agudo de Miocardio) improved survival in northern Galicia.
MethodsWe collected all events coded as STEMI between 2001 and 2013. A total of 6783 patients were identified and divided into 2 groups: pre-PROGALIAM (2001-2005), with 2878 patients, and PROGALIAM (2006-2013), with 3905 patients.
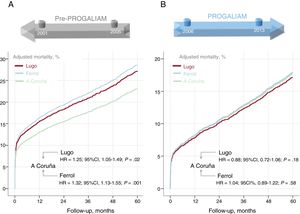
ResultsIn the pre-PROGALIAM period, 5-year adjusted mortality was higher both in the total population (HR, 1.22, 95%CI, 1.14–1.29; P <.001) and in each area (A Coruña: HR, 1.12; 95%CI, 1.02-1.23; P=.02; Lugo: HR, 1.34; 95%CI, 1.2-1.49; P <.001 and Ferrol: HR, 1.23; 95%CI, 1.1-1.4; P=.001). Before PROGALIAM, 5-year adjusted mortality was higher in the areas of Lugo (HR, 1.25; 95%CI, 1.05-1.49; P=.02) and Ferrol (HR, 1.32; 95%CI, 1.13-1.55; P=.001) than in A Coruña. These differences disappeared after the creation of the STEMI network (Lugo vs A Coruña: HR, 0.88; 95%CI, 0.72-1.06; P=.18, Ferrol vs A Coruña: HR, 1.04; 95%CI, 0.89-1.22; P=.58.
ConclusionsFor patients with STEMI, the creation of PROGALIAM in northern Galicia decreased mortality and increased equity in terms of survival both overall and in each of the areas where it was implemented.
This study was registered at ClinicalTrials.gov (Identifier: NCT02501070).
Keywords
Primary percutaneous coronary intervention (PPCI) was established in the last century as the best reperfusion strategy for patients with ST-segment elevation myocardial infarction (STEMI).1,2 However, unlike thrombolysis, PPCI can only be performed at centers with dedicated infrastructure and specially trained personnel. For STEMI patients located far from these specialized centers, transit to the PPCI unit inevitably involves delay. Nevertheless, the PRAGUE-23 and DANAMI-24 studies showed that these STEMI patients have a better chance of survival if transferred to a PPCI center than if given immediate thrombolysis. Since those studies, health care systems have organized multidisciplinary networks to identify STEMI patients early and ensure their rapid transit to PPCI centers. Spain was a pioneer in creating these “STEMI networks”, with the first such network established in Navarre in 2002. A year later, the APRIMUR network (Angioplastia Primaria en la Región de Murcia) was set up in Murcia.5 In May 2005, Galicia launched its own program, becoming the first multiprovincial Spanish autonomous community to establish a regional STEMI network. The Programa Gallego de Atención al Infarto Agudo de Miocardio (PROGALIAM) was organized with a hub & spoke structure built around 3 PPCI-capable hospitals: one located in northern Galicia, another in the center, and the third in the south. Several studies by PROGALIAM groups have shown that STEMI networks are feasible in a complex region with a very widely dispersed population and can improve clinical outcomes.6–9
The 2 main goals of the PROGALIAM network were as follows10:
- 1.
To reduce STEMI-associated morbidity and mortality in the Galician autonomous community.
- 2.
To promote equity in treatment and outcomes for STEMI patients.
The goal of the IPHENAMIC study (Impact on Public Health of a Network in Acute Myocardial Infarction Care) was to verify whether these 2 initial PROGALIAM goals had been achieved in the northern region of Galicia.
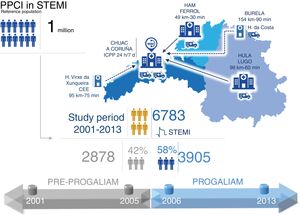
METHODSPROGALIAM organization in northern GaliciaIn the PROGALIAM protocol, the northern region of the Galician STEMI network includes the areas of Ferrol, Lugo, and A Coruña. This region has a population of approximately 1 million inhabitants. The PPCI referral hospital for the region is the Complejo Hospitalario Universitario A Coruña. The region also contains 4 non-PPCI hospitals. Of these, 2 are level 2 centers, one in Ferrol (Hospital Arquitecto Marcide) and the other in Lugo (Hospital Univesitario Lucus Augusti). The other 2 are district hospitals, one in the extreme west of the region and the other to the north of Lugo. The organization of the STEMI network in northern Galicia is presented in figure 1, including distances between hospitals and the quantity and location of available specially equipped ambulances.

The northern Galicia STEMI-treatment region, showing the the reference population, hospitals, specialized emergency services, and study periods examined in the IPHENAMIC study. CHUAC, Complejo Hospitalario Universitario de A Coruña; H, hospital; HAM, Hospital Arquitecto Marcide; HULA, Hospital Universitario Lucus Augusti; PPCI, primary percutaneous coronary intervention; STEMI, ST-segment elevation myocardial infarction.
The participating hospitals were asked to provide a list of all events registered in the Spanish NHS Minimum Data Set (MDS) under category 410 of the ICD-9-CM (International Classification of Diseases, Ninth Revision, Clinical Modification). A total of 10 495 STEMI admissions was identified in the period from January 2001 to December 2013. Each of the events recorded in the MDS was reviewed by accessing computerized medical records held by the Galician Health Service (IANUS system). When necessary, paper medical records were also consulted. The coordination, verification, and supervision of data collection was the responsibility of an assigned cardiologist in each area (M. López in Ferrol, M. Santás in Lugo, and G. Aldama in A Coruña). In total, 3712 events were excluded. Exclusion criteria were a principal diagnosis other than STEMI, an old STEMI diagnosis unrelated to the hospital admission in question, duplicate events, or failure to meet the criteria for STEMI stipulated in European Society of Cardiology clinical practice guidelines and the third universal definition of myocardial infarction.11,12 The study finally included 6783 patient events.
VariablesComputerized medical records (IANUS system) or paper files were consulted to collect demographic and clinical data, treatment variables, and vital status for each patient at discharge, at 1-year of follow-up, and at the latest follow-up examination. Latest follow-up was defined as the date of the most recent entry recording the patient's vital status. Variables were entered in a database via a specially designed web-based platform allowing remote, simultaneous, and certified access.
Study periodsThe IPHENAMIC study defined 2 periods for comparison (figure 1), one covering the period before implementation of the PROGALIAM network (January 2001 to December 2005) and the second covering the period since the network launch (January 2006 to December 2013).
Approval and registryThe IPHENAMIC study was approved by the Comité Autonómico de Investigación Clínica de Galicia (Registry Code 2014/257) and was entered in the ClinicalTrials.gov clinical studies registry with the identifier NCT02501070.
Statistical analysisDiscrete variables are expressed as percentages. Quantitative variables are expressed as mean±standard deviation. Comparisons between discrete variables were made by the chi-square test, and comparisons between quantitative variables were made by the Student t-test.
A survival analysis based on Cox regression was used to explore the impact of the PROGALIAM network on the study population, compare mortality between the 2 periods, and assess treatment equity between areas in both periods. The adjustment variables were those related to patient medical history, STEMI location, and clinical presentation (see “Cox regression models” in the ). The presence of collinearity in the model was tested by obtaining tolerance values and the variance inflation factor. In addition, each variable in the models was assessed to verify the proportional hazards hypothesis, as described by Grambsch and Therneau.13 When the proportionality assumption was violated, the variable was obligatorily included in the model, together with its time interaction ().
For each of the models, adjusted mortality curves were obtained at 30 days, 1 year, and 5 years for the pre-PROGALIAM and PROGALIAM periods. Adjusted mortality curves were also obtained and compared for the 3 geographical areas in both periods. For all comparisons, we obtained hazard ratios and corresponding 95% confidence intervals (95%CI).
Statistical analyses were performed with IBM-SPPSS version 24.0 (IBM; Armonk, New York, United States) and R version 3.5.1. Differences were considered statistically significant at P <.05.
RESULTSOf the 6783 patients included in the study, 2878 (42%) were treated in the pre-PROGALIAM period and 3905 (58%) were treated after the creation of the network (figure 1). By area, 3403 patients (50.1%) were from A Coruña, 1191 (29.4%) from Lugo, and 1389 (20.5%) from Ferrol.
Changes in clinical profile and STEMI presentationMean patient age was 66 years; 76.2% were men, 54% were smokers, 48% had hypertension, 40% had hypercholesterolemia, and 21% had diabetes.
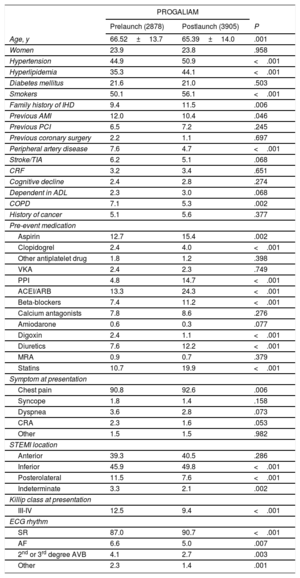
Overall differences in clinical profile and STEMI presentation between study periods are summarized in table 1. Study-period differences for each of the 3 areas are shown in .
Patient clinical characteristics and STEMI presentation by study period
| PROGALIAM | |||
|---|---|---|---|
| Prelaunch (2878) | Postlaunch (3905) | P | |
| Age, y | 66.52±13.7 | 65.39±14.0 | .001 |
| Women | 23.9 | 23.8 | .958 |
| Hypertension | 44.9 | 50.9 | <.001 |
| Hyperlipidemia | 35.3 | 44.1 | <.001 |
| Diabetes mellitus | 21.6 | 21.0 | .503 |
| Smokers | 50.1 | 56.1 | <.001 |
| Family history of IHD | 9.4 | 11.5 | .006 |
| Previous AMI | 12.0 | 10.4 | .046 |
| Previous PCI | 6.5 | 7.2 | .245 |
| Previous coronary surgery | 2.2 | 1.1 | .697 |
| Peripheral artery disease | 7.6 | 4.7 | <.001 |
| Stroke/TIA | 6.2 | 5.1 | .068 |
| CRF | 3.2 | 3.4 | .651 |
| Cognitive decline | 2.4 | 2.8 | .274 |
| Dependent in ADL | 2.3 | 3.0 | .068 |
| COPD | 7.1 | 5.3 | .002 |
| History of cancer | 5.1 | 5.6 | .377 |
| Pre-event medication | |||
| Aspirin | 12.7 | 15.4 | .002 |
| Clopidogrel | 2.4 | 4.0 | <.001 |
| Other antiplatelet drug | 1.8 | 1.2 | .398 |
| VKA | 2.4 | 2.3 | .749 |
| PPI | 4.8 | 14.7 | <.001 |
| ACEI/ARB | 13.3 | 24.3 | <.001 |
| Beta-blockers | 7.4 | 11.2 | <.001 |
| Calcium antagonists | 7.8 | 8.6 | .276 |
| Amiodarone | 0.6 | 0.3 | .077 |
| Digoxin | 2.4 | 1.1 | <.001 |
| Diuretics | 7.6 | 12.2 | <.001 |
| MRA | 0.9 | 0.7 | .379 |
| Statins | 10.7 | 19.9 | <.001 |
| Symptom at presentation | |||
| Chest pain | 90.8 | 92.6 | .006 |
| Syncope | 1.8 | 1.4 | .158 |
| Dyspnea | 3.6 | 2.8 | .073 |
| CRA | 2.3 | 1.6 | .053 |
| Other | 1.5 | 1.5 | .982 |
| STEMI location | |||
| Anterior | 39.3 | 40.5 | .286 |
| Inferior | 45.9 | 49.8 | <.001 |
| Posterolateral | 11.5 | 7.6 | <.001 |
| Indeterminate | 3.3 | 2.1 | .002 |
| Killip class at presentation | |||
| III-IV | 12.5 | 9.4 | <.001 |
| ECG rhythm | |||
| SR | 87.0 | 90.7 | <.001 |
| AF | 6.6 | 5.0 | .007 |
| 2nd or 3rd degree AVB | 4.1 | 2.7 | .003 |
| Other | 2.3 | 1.4 | .001 |
ACEI, angiotensin converting enzyme inhibitor; ADL, activities of daily life; AF, atrial fibrillation; AMI, acute myocardial infarction; ARB, angiotensin receptor blocker; AVB, atrioventricular block; COPD, chronic obstructive pulmonary disease; CRA, cardiorespiratory arrest; CRF, chronic renal failure; ECG, electrocardiogram; IHD, ischemic heart disease; MRA, mineralocorticoid receptor antagonist; PCI, percutaneous coronary intervention; PPI, proton pump inhibitor; PROGALIAM, Programa Gallego de Atención al Infarto Agudo de Miocardio; SR, sinus rhythm; STEMI, ST-segment elevation myocardial infarction; TIA, transient ischemic attack; VKA, vitamin K antagonists.
Data are expressed as No. (%) or mean ± standard deviation.
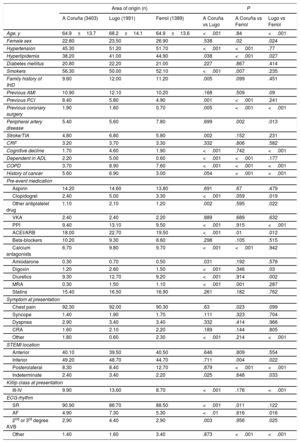
Comparisons by area revealed differences in patient profile and STEMI presentation that were especially pronounced between the A Coruña area and the Lugo and Ferrol areas (table 2).
Patient clinical characteristics and STEMI presentation by geographical area of origin
| Area of origin (n) | P | |||||
|---|---|---|---|---|---|---|
| A Coruña (3403) | Lugo (1991) | Ferrol (1389) | A Coruña vs Lugo | A Coruña vs Ferrol | Lugo vs Ferrol | |
| Age, y | 64.9±13.7 | 68.2±14.1 | 64.9±13.6 | <.001 | .84 | <.001 |
| Female sex | 22.80 | 23.50 | 26.90 | .538 | .02 | .024 |
| Hypertension | 45.30 | 51.20 | 51.70 | <.001 | <.001 | .77 |
| Hyperlipidemia | 38.20 | 41.00 | 44.90 | .038 | <.001 | .027 |
| Diabetes mellitus | 20.80 | 22.20 | 21.00 | .227 | .867 | .414 |
| Smokers | 56.30 | 50.00 | 52.10 | <.001 | .007 | .235 |
| Family history of IHD | 9.60 | 12.00 | 11.20 | .005 | .099 | .451 |
| Previous AMI | 10.90 | 12.10 | 10.20 | .168 | .509 | .09 |
| Previous PCI | 8.40 | 5.80 | 4.90 | .001 | <.001 | .241 |
| Previous coronary surgery | 1.90 | 1.60 | 0.70 | .005 | <.001 | <.001 |
| Peripheral artery disease | 5.40 | 5.60 | 7.80 | .699 | .002 | .013 |
| Stroke/TIA | 4.80 | 6.80 | 5.80 | .002 | .152 | .231 |
| CRF | 3.20 | 3.70 | 3.30 | .332 | .806 | .582 |
| Cognitive decline | 1.70 | 4.60 | 1.90 | <.001 | .742 | <.001 |
| Dependent in ADL | 2.20 | 5.00 | 0.60 | <.001 | <.001 | .177 |
| COPD | 3.70 | 8.90 | 7.60 | <.001 | <.001 | <.001 |
| History of cancer | 5.60 | 6.90 | 3.00 | .054 | <.001 | <.001 |
| Pre-event medication | ||||||
| Aspirin | 14.20 | 14.60 | 13.80 | .691 | .67 | .479 |
| Clopidogrel | 2.40 | 5.00 | 3.30 | <.001 | .059 | .019 |
| Other antiplatelet drug | 1.10 | 2.10 | 1.20 | .002 | .595 | .022 |
| VKA | 2.40 | 2.40 | 2.20 | .889 | .689 | .632 |
| PPI | 9.40 | 13.10 | 9.50 | <.001 | .915 | <.001 |
| ACEI/ARB | 18.00 | 22.70 | 19.50 | <.001 | .01 | .012 |
| Beta-blockers | 10.20 | 9.30 | 8.60 | .298 | .105 | .515 |
| Calcium antagonists | 6.70 | 9.80 | 9.70 | <.001 | <.001 | .942 |
| Amiodarone | 0.30 | 0.70 | 0.50 | .031 | .192 | .578 |
| Digoxin | 1.20 | 2.60 | 1.50 | <.001 | .346 | .03 |
| Diuretics | 9.30 | 12.70 | 9.20 | <.001 | .914 | .002 |
| MRA | 0.30 | 1.50 | 1.10 | <.001 | .001 | .287 |
| Statins | 15.40 | 16.50 | 16.90 | .261 | .182 | .762 |
| Symptom at presentation | ||||||
| Chest pain | 92.30 | 92.00 | 90.30 | .63 | .023 | .099 |
| Syncope | 1.40 | 1.90 | 1.70 | .111 | .323 | .704 |
| Dyspnea | 2.90 | 3.40 | 3.40 | .332 | .414 | .966 |
| CRA | 1.60 | 2.10 | 2.20 | .189 | .144 | .805 |
| Other | 1.80 | 0.60 | 2.30 | <.001 | .214 | <.001 |
| STEMI location | ||||||
| Anterior | 40.10 | 39.50 | 40.50 | .646 | .809 | .554 |
| Inferior | 49.20 | 48.70 | 44.70 | .711 | .004 | .022 |
| Posterolateral | 8.30 | 8.40 | 12.70 | .879 | <.001 | <.001 |
| Indeterminate | 2.40 | 3.40 | 2.20 | .025 | .648 | .033 |
| Killip class at presentation | ||||||
| III-IV | 9.90 | 13.60 | 8.70 | <.001 | .176 | <.001 |
| ECG rhythm | ||||||
| SR | 90.90 | 86.70 | 88.50 | <.001 | .011 | .122 |
| AF | 4.90 | 7.30 | 5.30 | <.01 | .616 | .016 |
| 2nd or 3rd degree AVB | 2.90 | 4.40 | 2.90 | .003 | .956 | .025 |
| Other | 1.40 | 1.60 | 3.40 | .873 | <.001 | <.001 |
ACEI, angiotensin converting enzyme inhibitor; ADL, activities of daily life; AF, atrial fibrillation; AMI, acute myocardial infarction; ARB, angiotensin receptor blocker; AVB, atrioventricular block; COPD, chronic obstructive pulmonary disease; CRA, cardiorespiratory arrest; CRF, chronic renal failure; ECG, electrocardiogram; IHD, ischemic heart disease; MRA, mineralocorticoid receptor antagonist; PCI, percutaneous coronary intervention; PPI, proton pump inhibitor; SR, sinus rhythm; STEMI, ST-segment elevation myocardial infarction; TIA, transient ischemic attack; VKA, vitamin K antagonists.
Data are expressed as No. (%) or mean ± standard deviation.
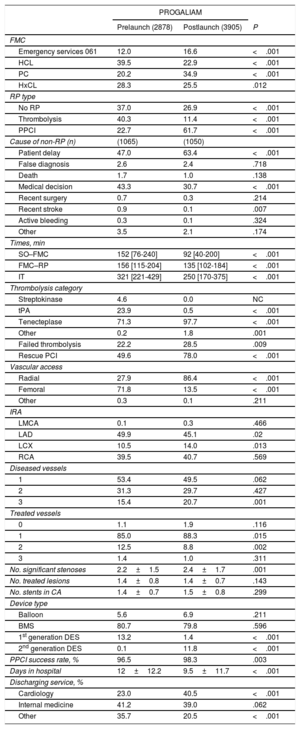
Of the STEMI patients treated during the 2001-2013 period, 2115 did not receive reperfusion (31.2%). The 2 main causes of nonreperfusion were a >24 hour delay in contacting the health system (1166 patients [55.2%]) and medical decision (783 patients [37%]). Of the 4668 reperfused patients, 1604 (34.4%) were reperfused by thrombolysis. PPCI was given to 3064 patients (65.6%), and in 2278 of these patients (74.3%) vascular access was via the radial route. The most frequent culprit artery was the anterior descending artery (1409 patients [46%]), and half of these patients had multivessel disease. The reperfusion success rate was 98%, as defined by the presence of TIMI 3 flow and residual stenosis <20% on angiography. The median delay between symptom onset and first medical contact was 120 min, and the median delay between first medical contact and reperfusion was 142 min; median overall ischemia time was 277 min.
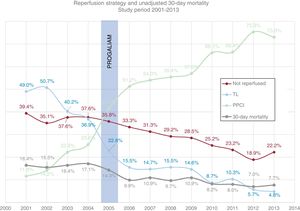
Comparison of the 2 study periods revealed major changes in the treatment of STEMI patients after the launch of the PROGALIAM network (table 3). The reperfusion rate, reperfusion strategy used, and unadjusted 30-day mortality are plotted against year of treatment in figure 2. The chart reveals a change in reperfusion strategy dating from the launch of the PROGALIAM network (2006), with a marked increase in the number of patients reperfused by PPCI and a corresponding decline in reperfusion by thrombolysis.
STEMI patient treatment stratified by study period
| PROGALIAM | |||
|---|---|---|---|
| Prelaunch (2878) | Postlaunch (3905) | P | |
| FMC | |||
| Emergency services 061 | 12.0 | 16.6 | <.001 |
| HCL | 39.5 | 22.9 | <.001 |
| PC | 20.2 | 34.9 | <.001 |
| HxCL | 28.3 | 25.5 | .012 |
| RP type | |||
| No RP | 37.0 | 26.9 | <.001 |
| Thrombolysis | 40.3 | 11.4 | <.001 |
| PPCI | 22.7 | 61.7 | <.001 |
| Cause of non-RP (n) | (1065) | (1050) | |
| Patient delay | 47.0 | 63.4 | <.001 |
| False diagnosis | 2.6 | 2.4 | .718 |
| Death | 1.7 | 1.0 | .138 |
| Medical decision | 43.3 | 30.7 | <.001 |
| Recent surgery | 0.7 | 0.3 | .214 |
| Recent stroke | 0.9 | 0.1 | .007 |
| Active bleeding | 0.3 | 0.1 | .324 |
| Other | 3.5 | 2.1 | .174 |
| Times, min | |||
| SO–FMC | 152 [76-240] | 92 [40-200] | <.001 |
| FMC–RP | 156 [115-204] | 135 [102-184] | <.001 |
| IT | 321 [221-429] | 250 [170-375] | <.001 |
| Thrombolysis category | |||
| Streptokinase | 4.6 | 0.0 | NC |
| tPA | 23.9 | 0.5 | <.001 |
| Tenecteplase | 71.3 | 97.7 | <.001 |
| Other | 0.2 | 1.8 | .001 |
| Failed thrombolysis | 22.2 | 28.5 | .009 |
| Rescue PCI | 49.6 | 78.0 | <.001 |
| Vascular access | |||
| Radial | 27.9 | 86.4 | <.001 |
| Femoral | 71.8 | 13.5 | <.001 |
| Other | 0.3 | 0.1 | .211 |
| IRA | |||
| LMCA | 0.1 | 0.3 | .466 |
| LAD | 49.9 | 45.1 | .02 |
| LCX | 10.5 | 14.0 | .013 |
| RCA | 39.5 | 40.7 | .569 |
| Diseased vessels | |||
| 1 | 53.4 | 49.5 | .062 |
| 2 | 31.3 | 29.7 | .427 |
| 3 | 15.4 | 20.7 | .001 |
| Treated vessels | |||
| 0 | 1.1 | 1.9 | .116 |
| 1 | 85.0 | 88.3 | .015 |
| 2 | 12.5 | 8.8 | .002 |
| 3 | 1.4 | 1.0 | .311 |
| No. significant stenoses | 2.2±1.5 | 2.4±1.7 | .001 |
| No. treated lesions | 1.4±0.8 | 1.4±0.7 | .143 |
| No. stents in CA | 1.4±0.7 | 1.5±0.8 | .299 |
| Device type | |||
| Balloon | 5.6 | 6.9 | .211 |
| BMS | 80.7 | 79.8 | .596 |
| 1st generation DES | 13.2 | 1.4 | <.001 |
| 2nd generation DES | 0.1 | 11.8 | <.001 |
| PPCI success rate, % | 96.5 | 98.3 | .003 |
| Days in hospital | 12±12.2 | 9.5±11.7 | <.001 |
| Discharging service, % | |||
| Cardiology | 23.0 | 40.5 | <.001 |
| Internal medicine | 41.2 | 39.0 | .062 |
| Other | 35.7 | 20.5 | <.001 |
BMS, bare-metal stent; CA, culprit artery; DES, drug-eluting stent; FMC, first medical contact; HCL, hospital with catheterization laboratory; HxCL, hospital without a catheterization laboratory; IRA, infarct-related artery; IT, ischemia time; LAD, left anterior descending artery; LCX, left circumflex artery; LMCA, left main coronary artery; NC, noncalculable; PC, primary care; PCI, percutaneous coronary intervention; PPCI, primary percutaneous coronary intervention; PROGALIAM, Programa Gallego de Atención al Infarto Agudo de Miocardio; RCA, right coronary artery; RP, reperfusion; SO, symptom onset; STEMI, ST-segment elevation myocardial infarction; tPA, tissue plasminogen activator.
Unless indicated otherwise, data are expressed as No. (%), mean ± standard deviation or median [interquartle range].

Annual changes in reperfusion method and unadjusted 30-day mortality among STEMI patients. The creation of the PROGALIUM network is indicated. PPCI, primary percutaneous coronary intervention; PROGALIAM, Programa Gallego de Atención al Infarto Agudo de Miocardio; STEMI, ST-segment elevation myocardial infarction; TL, thrombolysis.
These changes are also evident from comparison of the 2 study periods in each of the 3 areas ().
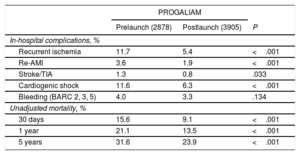
Impact on clinical resultsIn-hospital complications among the 6783 patients were as follows: 547 (8.1%) had recurrent myocardial ischemia, defined as a new episode of characteristic chest pain accompanied by electrocardiogram changes; 177 (2.6%) had a repeat myocardial infarction, defined as a new episode of chest pain with or without electrocardiogram changes and accompanied by an increase in myocardial injury markers; 77 (1%) had a stroke or a transient ischemic attack; 784 (11.6%) had cardiogenic shock; and 242 (3.6%) had an actionable bleeding episode (Bleeding Academic Research Consortium types 2, 3, or 514). Median follow-up time was 68 months [interquartile range, 28-109 months]. The rates of 30-day, 1-year, and 5-year mortality were 11.9%, 16.7%, and 27.2%, respectively.
After the creation of the PROGALIAM network, there was a significant decline in the proportion of patients experiencing complications during hospitalization. The rates of 30-day, 1-year, and 5-year mortality in this period were also lower, both in the total population (table 4) and in each of the 3 study areas ().
Univariate comparison of in-hospital complications and mortality by study period
| PROGALIAM | |||
|---|---|---|---|
| Prelaunch (2878) | Postlaunch (3905) | P | |
| In-hospital complications, % | |||
| Recurrent ischemia | 11.7 | 5.4 | <.001 |
| Re-AMI | 3.6 | 1.9 | <.001 |
| Stroke/TIA | 1.3 | 0.8 | .033 |
| Cardiogenic shock | 11.6 | 6.3 | <.001 |
| Bleeding (BARC 2, 3, 5) | 4.0 | 3.3 | .134 |
| Unadjusted mortality, % | |||
| 30 days | 15.6 | 9.1 | <.001 |
| 1 year | 21.1 | 13.5 | <.001 |
| 5 years | 31.6 | 23.9 | <.001 |
AMI, acute myocardial infarction; BARC, Bleeding Academic Research Consortium; PROGALIAM, Programa Gallego de Atención al Infarto Agudo de Miocardio; TIA, transient ischemic attack.
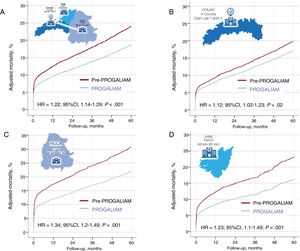
To determine whether the decline in survival was due to the implementation of the PROGALIAM network, we adjusted the mortality rates in each study period according patient clinical characteristics and STEMI location and presentation. In the PROGALIAM period, adjusted mortality was significantly lower in the total population and in each area at 30 days (), 1 year (), and 5 years (figure 3).
 and the PROGALIAM period (blue). The charts show the hazard ratios (pre-PROGALIAM vs PROGALIAM) and the corresponding confidence intervals. A) Total population. B) Population in the A Coruña area. C, Population in the Lugo area. D, Population in the Ferrol area. 95%CI, 95% confidence interval; CHUAC, Complejo Hospitalario Universitario de A Coruña; HAM, Hospital Arquitecto Marcide; HR, hazard ratio; HULA, Hospital Universitario Lucus Augusti.")
Adjusted 5-year mortality curves for the pre-PROGALIAM period (red) and the PROGALIAM period (blue). The charts show the hazard ratios (pre-PROGALIAM vs PROGALIAM) and the corresponding confidence intervals. A) Total population. B) Population in the A Coruña area. C, Population in the Lugo area. D, Population in the Ferrol area. 95%CI, 95% confidence interval; CHUAC, Complejo Hospitalario Universitario de A Coruña; HAM, Hospital Arquitecto Marcide; HR, hazard ratio; HULA, Hospital Universitario Lucus Augusti.
To assess the success of PROGALIAM in achieving equity in treatment and outcomes for STEMI patients, we compared adjusted mortality between the different areas. Adjusted 5-year mortality curves are shown in figure 4. In the pre-PROGALIAM period, 5-year adjusted mortality was higher in the Lugo and Ferrol areas than in the A Coruña area, where the regional PPCI referral hospital is located (figure 4A). After implementation of the PROGALIUM network, these differences in mortality disappeared (figure 4B). The same result was found in the analysis of areas and study periods for mortality at 30 days () and at 1 year ().
, Lugo (red), and Ferrol (blue). The charts show hazard ratios (pre-PROGALIAM vs PROGALIAM) and the corresponding confidence intervals. A) pre-PROGALIAM period. B) PROGALIAM period. 95%CI, 95% confidence interval; HR, hazard ratio; PROGALIAM, Programa Gallego de Atención al Infarto Agudo de Miocardio.")
Adjusted 5-year mortality curves for the 3 areas of northern Galicia in PROGALIAM: A Coruña (green), Lugo (red), and Ferrol (blue). The charts show hazard ratios (pre-PROGALIAM vs PROGALIAM) and the corresponding confidence intervals. A) pre-PROGALIAM period. B) PROGALIAM period. 95%CI, 95% confidence interval; HR, hazard ratio; PROGALIAM, Programa Gallego de Atención al Infarto Agudo de Miocardio.
The IPHENAMIC study shows that implementation of the PROGALIAM network has brought about a significant decrease in adjusted mortality over the short-, mid-, and long-term, both overall and in each geographical area in northern Galicia. Unequal mortality rates before the launch of the network indicate inequity in health care across northern Galicia, with STEMI mortality higher in areas with no PPCI-capable hospital. After the program launch, these inequalities disappeared, and short-term, mid-term, and long-term mortality equalized. One of the key factors explaining this result is likely to be the major shift in reperfusion strategy for STEMI patients. PPCI was used in a third of patients in the pre-PROGALIAM period, but its use rose to almost 9 out of 10 patients after implementation of the network. This change was accompanied by a marked increase in the use of rescue PCI after failed thrombolysis, and there was also a less marked but nevertheless continous decline in the proportion of patients not receiving reperfusion during the 2001-2013 study period (figure 2). There was also an increase in the rate of radial access in PPCI, which yields better results than femoral access,15 and this was accompanied by an increase in the PPCI success rate. These factors may also have contributed to the decline in mortality in the PROGALIAM period. The changes documented in the total population were more pronounced in Lugo and Ferrol, the areas lacking a PPCI hospital. Before PROGALIAM, these areas had nonreperfusion rates> 40% and rates of PPCI use <10%. After the implementation of PROGALIAM, the percentage of nonreperfused patients dropped by more than 30% in the Lugo and Ferrol areas and by around 20% in A Coruña (). Moreover, PPCI use increased 10-fold in the Ferrol area, 6-fold in Lugo, and almost 2-fold in A Coruña. These changes would explain the more pronounced reductions in adjusted short-, mid-, and long-term mortality in Lugo and Ferrol than in A Coruña. The changes in PPCI use would also explain the finding that pre-PROGALIAM adjusted mortality was 25% higher in Lugo and 32% higher in Ferrol than in A Coruña, whereas after the creation of the network these differences disappeared (figure 4).
These are excellent results; however, the data analysis reveals several areas where there is room for improvement. Although reperfusion time decreased significantly in the PROGALIAM period, to a median value of 135minutes, this still exceeds the maximum delay recommended in clinical practice guidelines. The data also reveal notably low rates of network access via emergency and cardiology services. It is possible that changes in these areas would have further improved outcomes for patients treated after the creation of the network.
The establishment of STEMI networks is recommended in clinical practice guidelines.16 However, little is known about the impact of these networks on their target populations. The STEMI networks established across the different Spanish autonomous communities were assessed by Cequier et al. in an analysis of MDS data; these authors found that STEMI networks were associated with an approximately 50% increase in the rate of PCI and an approximately 14% reduction in risk-adjusted in-hospital mortality.17 Our findings show that the PROGALIAM network has tripled the rate of PPCI in northern Galicia, accompanied by a parallel ∼50% drop in unadjusted and adjusted 30-day mortality ().
Although not specifically focused on STEMI networks, 2 European registries have explored changes in STEMI treatment and their impact over 20 years of follow-up: SWEEDHEART18 in Sweden and FAST-MI19 in France. In line with our findings, the Swedish and French registries both showed an increase in the rate of reperfusion by PPCI. In the Swedish registry, the rate of PPCI increased from 14.4% of STEMI patients in 2001 to 78% in 2013. For the same period, the French registry reveals an increase from 23% to 76%, and our registry shows an increase from 11.6% to 73%. In parallel, 30-day mortality over the same period declined from 12.2% to 9.2% in Sweden and from 11.8% to 6.8% in France, compared with a decline from 16.4% in 2001 to 7.7% in 2013 in our registry. The decrease in mortality is indisputably not solely attributable to the increase in reperfusion by PPCI; key contributions are certain to have come from other factors, such as improvements in treatment and closer adhesion to clinical practice guideline recommendations. Nevertheless, the monitored and audited patient care in STEMI networks allows faster and more even implementation of evidence-based treatment advances. This translates into improvements in every link in the STEMI care chain, while also allowing treatments and guideline recommendations to be adapted to the local needs of the network area.
LimitationsThis study has several limitations. Although we accessed all relevant STEMI patient data through an exhaustive search of the MDS and individually reviewed each event, this was an observational study, and we therefore cannot exlude bias in patient selection. Moreover, the database may not have recorded important confounding factors that therefore could not be included as adjustment variables. Similarly, the introduction of new treatments is likely to have disproportionately benefitted the more recent group. Nevertheless, the consistency in the decline in mortality for all periods examined (30 days, 1 year, and 5 years) and across all 3 geographical areas supports the conclusion that the implementation of the PROGALIAM STEMI network was responsible for the observed improvements in patient survival.
CONCLUSIONSThe IPHENAMIC study demonstrates that the implementation of the PROGALIAM network in northern Galicia has achieved its 2 main goals: reducing mortality among STEMI patients and increasing equality of treatment. Treatment equality was achieved not only in even access to the best available reperfusion therapy, but also in increased survival after STEMI independently of the timeframe explored or patients’ geographical location. This outcome satisfies the underlying belief driving the PROGALIAM network: that the place of residence should have no bearing on survival.
FUNDINGThe work reported in this article was supported by an unconditional financial award from AstraZeneca (ESR-ISSBRIL0179).
CONFLICTS OF INTERESTNone declared.
- -
STEMI networks increase the overall rate of reperfusion and the percentage of patients treated by PPCI in the areas where they operate.
- -
There is very little available information on the impact of STEMI networks on the long-term mortality of STEMI patients in Spain.
- -
Studies have not examined whether STEMI networks increase health care equity for patients from areas without a PPCI hospital, in terms of access to the best reperfusion therapy and survival.
- -
Implementation of the PROGALIAM network has changed the treatment of STEMI patients in northern Galicia, with a significant increase in the rate of reperfusion by PPCI.
- -
These changes were more pronounced in the areas lacking a PPCI hospital, which benefitted more from the introduction of the network.
- -
Adjusted 5-year mortality was consistently lower after the implementation of the PROGALIAM network, both in general and in each geographical area.
- -
The impact on mortality was more pronounced in areas without a PPCI hospital, with the implementation of the network bringing equity in survival.
.
The authors wish to express their gratitude to all those whose past and present contributions have made PROGALIAM a reality.