The NCD Risk Factor Collaboration has recently published the results of a study on global trends in body mass index (BMI) between 1975 and 2014.1 The study, which included a sample of almost 20 million people from 200 countries, demonstrates the apparent failure of public policies aimed at curbing obesity. At the same time, the persistence of underweight in certain regions of the world demonstrates that malnutrition is still present, and this situation entails other health risks.2
The aim of this study was to analyze the trend of the nutritional status of the Spanish adult population over a recent period (2009-2014) based on data from the European Health Surveys in Spain (EHSS),3 conducted by the Spanish National Institute of Statistics within the framework of the European Health Interview Surveys (EHIS). These surveys collect information on weight and height, as reported by participants. They were asked: “Could you tell me your height, approximately, without shoes? (in cm)” and “How much do you weigh, approximately, without shoes or clothes? (in kg)”. Based on the information provided, the BMI was calculated (weight [in kg] / height2 [in meters]) and individuals were classified into the following categories: underweight (BMI < 18.5), normal weight (BMI ≥ 18.5-< 25), overweight (BMI ≥ 25-< 30), and obesity (BMI ≥ 30). The EHSS includes individuals aged 16 or older, and after exclusion of those younger than 18 years, a sample of 20 234 individuals was studied in 2009 and 21 283 in 2014.
To analyze the effect of age, the sample was stratified into the following age groups: 18 to 39, 40 to 59, 60 to 79 and ≥ 80 years. The prevalence of the nutritional categories was calculated with 95% confidence intervals (95%CI) for both the sample as a whole and disaggregated by age and sex. To allow comparisons, the prevalences were adjusted in advance using the direct method, taking the whole series as the standard. A logistic regression analysis was performed (odds ratio [OR]; 95%CI) independently for each BMI category (underweight, overweight, and obesity) compared with normal weight, specifically for each sex, with age adjustment. Statistical processing was carried out using the Stata 12.0 and Epidat 4.1 programs.
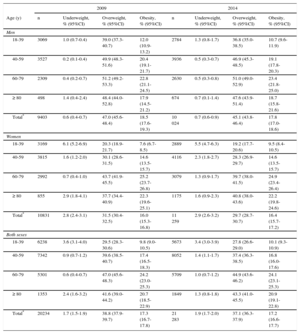
Table shows the prevalences of underweight, overweight, and obesity in the Spanish adult population, overall and disaggregated by sex and age, in 2009 and 2014. In both EHSS studied, overweight and obesity increased with age in both sexes between the ages of 18 and 79 years (P < .001). At the same time, underweight decreased in persons aged between 18 and 60 years and increased in those older than 80 years. The proportion of excess weight (overweight plus obesity) was higher in men in all ages (P < .001), although a larger proportion of obese women was observed after the age of 60 years. In contrast, the prevalence of underweight was higher in all the age groups of the female series (P < .001). It should be highlighted that these differences by age and sex are in line with the observations from the ENPE4 and ANIBES5 studies, although the age range in both was more limited (up to the age of 64 years).
Prevalence of Low Weight, Overweight and Obesity in the Spanish Adult Population by Age and Sex, Based on the EHSS from 2009 and 2014
| 2009 | 2014 | |||||||
|---|---|---|---|---|---|---|---|---|
| Age (y) | n | Underweight, % (95%CI) | Overweight, % (95%CI) | Obesity, % (95%CI) | n | Underweight, % (95%CI) | Overweight, % (95%CI) | Obesity, % (95%CI) |
| Men | ||||||||
| 18-39 | 3069 | 1.0 (0.7-0.4) | 39.0 (37.3-40.7) | 12.0 (10.9-13.2) | 2784 | 1.3 (0.8-1.7) | 36.8 (35.0-38.5) | 10.7 (9.6-11.9) |
| 40-59 | 3527 | 0.2 (0.1-0.4) | 49.9 (48.3-51.6) | 20.4 (19.1-21.7) | 3936 | 0.5 (0.3-0.7) | 46.9 (45.3-48.5) | 19.1 (17.8-20.3) |
| 60-79 | 2309 | 0.4 (0.2-0.7) | 51.2 (49.2-53.3) | 22.8 (21.1-24.5) | 2630 | 0.5 (0.3-0.8) | 51.0 (49.0-52.9) | 23.4 (21.8-25.0) |
| ≥ 80 | 498 | 1.4 (0.4-2.4) | 48.4 (44.0-52.8) | 17.9 (14.5-21.2) | 674 | 0.7 (0.1-1.4) | 47.6 (43.9-51.4) | 18.7 (15.8-21.6) |
| Total* | 9403 | 0.6 (0.4-0.7) | 47.0 (45.6-48.4) | 18.5 (17.6-19.3) | 10 024 | 0.7 (0.6-0.9) | 45.1 (43.8-46.4) | 17.8 (17.0-18.6) |
| Women | ||||||||
| 18-39 | 3169 | 6.1 (5.2-6.9) | 20.3 (18.9-21.7) | 7.6 (6.7-8.5) | 2889 | 5.5 (4.7-6.3) | 19.2 (17.7-20.6) | 9.5 (8.4-10.5) |
| 40-59 | 3815 | 1.6 (1.2-2.0) | 30.1 (28.6-31.5) | 14.6 (13.5-15.7) | 4116 | 2.3 (1.8-2.7) | 28.3 (26.9-29.7) | 14.6 (13.5-15.7) |
| 60-79 | 2992 | 0.7 (0.4-1.0) | 43.7 (41.9-45.5) | 25.2 (23.7-26.8) | 3079 | 1.3 (0.9-1.7) | 39.7 (38.0-41.5) | 24.9 (23.4-26.4) |
| ≥ 80 | 855 | 2.9 (1.8-4.1) | 37.7 (34.4-40.9) | 22.3 (19.6-25.1) | 1175 | 1.6 (0.9-2.3) | 40.8 (38.0-43.6) | 22.2 (19.8-24.6) |
| Total* | 10831 | 2.8 (2.4-3.1) | 31.5 (30.4-32.5) | 16.0 (15.3-16.8) | 11 259 | 2.9 (2.6-3.2) | 29.7 (28.7-30.7) | 16.4 (15.7-17.2) |
| Both sexes | ||||||||
| 18-39 | 6238 | 3.6 (3.1-4.0) | 29.5 (28.3-30.6) | 9.8 (9.0-10.5) | 5673 | 3.4 (3.0-3.9) | 27.8 (26.6-29.0) | 10.1 (9.3-10.9) |
| 40-59 | 7342 | 0.9 (0.7-1.2) | 39.6 (38.5-40.7) | 17.4 (16.5-18.3) | 8052 | 1.4 (1.1-1.7) | 37.4 (36.3-38.5) | 16.8 (16.0-17.6) |
| 60-79 | 5301 | 0.6 (0.4-0.7) | 47.0 (45.6-48.3) | 24.2 (23.0-25.3) | 5709 | 1.0 (0.7-1.2) | 44.9 (43.6-46.2) | 24.1 (23.1-25.3) |
| ≥ 80 | 1353 | 2.4 (1.6-3.2) | 41.6 (39.0-44.2) | 20.7 (18.5-22.9) | 1849 | 1.3 (0.8-1.8) | 43.3 (41.0-45.5) | 20.9 (19.1-22.8) |
| Total* | 20234 | 1.7 (1.5-1.9) | 38.8 (37.9-39.7) | 17.3 (16.7-17.8) | 21 283 | 1.9 (1.7-2.0) | 37.1 (36.3-37.9) | 17.2 (16.6-17.7) |
95%CI, 95% confidence interval.
The total proportion of overweight indicated in the ENPE study (39.3%) was in the range of variation corresponding to the EHSS from 2009 and 2014, while that corresponding to the ANIBES study (35.5%) was slightly lower. In both studies, which are based on anthropometric data, the prevalence of obesity (21.6% and 19.9%, respectively) was somewhat higher than that observed in the present study, which could be explained by the fact that obese individuals tend to underestimate their weight.6
With regard to time trend, which was the main purpose of this study, the prevalence of underweight between 2009 and 2014 remained virtually the same in both sexes, while overweight (OR = 0.89; 95%CI, 0.84-0.95; P < .001) and obesity (OR = 0.90; 95%CI, 0.82-0.97; P < .05) decreased significantly in men. Overweight also decreased in women (OR = 0.90; 95%CI, 0.84-0.96; P < .01), although no decrease was found in the prevalence of obesity. Despite the limitation involved in working with information that was self-reported by the individuals surveyed,6 the positive trend detected in this single 5-year period offers a cautiously optimistic outlook. It would be worth assessing whether this trend remains stable over time and whether it is the result of the effort of the sectors involved in public health to control cardiovascular risk factors.