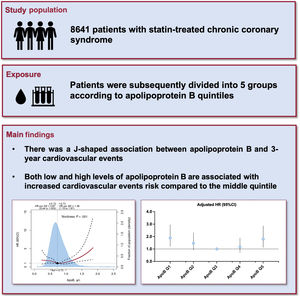

The association between apolipoprotein B (apoB) and residual cardiovascular (CV) risk in patients with chronic coronary syndrome (CCS) remains unclear. We aimed to investigate the association between apoB levels and CV outcomes in statin-treated CCS patients.
MethodsWe enrolled 8641 statin-treated CCS patients at Fuwai Hospital. The patients were divided into 5 groups based on to apoB quintiles (Q1 to Q5). The primary endpoint was 3-year CV events, including CV death, nonfatal myocardial infarction, and nonfatal stroke.
ResultsDuring a median follow-up of 3.17 years, there were 232 (2.7%) CV events. After multivariable adjustment, a restricted cubic spline illustrated a J-shaped relationship between apoB levels and 3-year CV events, with the risk remaining flat until apoB levels exceeded 0.73g/L, after which the risk increased (nonlinear P <.05). Kaplan-Meier curves showed the lowest CV event rate in the Q3 group (0.68-0.78g/L). Compared with the Q3 group, multivariable Cox regression models revealed that both low (Q1, ≤0.57g/L) and high (Q5, >0.93g/L) apoB levels were associated with an increased risk of major adverse cardiac events (all P <.05). Notably, patients with low apoB levels (Q1) had the highest risk of CV death (HR, 2.44; 95%CI, 1.17-5.08).
ConclusionsOur analysis indicates that both low and high levels of apoB are associated with elevated CV risk, with the risk being particularly pronounced at higher levels (> 0.73g/L).
Keywords
Cardiovascular (CV) disease, particularly coronary artery disease (CAD), remains the leading cause of mortality worldwide.1 Since low-density lipoprotein cholesterol (LDL-C) is a major pathogenic factor in CAD and is associated with CAD mortality, current lipid modification guidelines mainly focus on reducing LDL-C concentrations to lower the risk of adverse CV events in patients with established CAD.2,3 However, numerous clinical trials of statins and other LDL-C-lowering medications have demonstrated that residual CV risk persists even with aggressive LDL-C management. This finding has prompted further exploration into determinants of residual CV risk, especially serum-based biomarkers that can be easily measured in clinical settings.4,5
Recently, the European Atherosclerosis Society (EAS) and the European Federation of Clinical Chemistry and Laboratory Medicine (EFLM) published guidelines on quantifying atherogenic lipoproteins for lipid-lowering strategies. They suggest that apolipoprotein B (apoB) could be considered a potential biomarker for assessing residual CV risk in patients receiving optimal LDL-C-lowering treatment.6 Previous Mendelian randomization studies found that reductions in CV risk were associated with genetic variations affecting the clearance and processing of apoB-containing lipoproteins. These studies suggest that apoB may be a more accurate biomarker for assessing CV risk than LDL-C.7,8 However, there is insufficient robust clinical evidence with large sample sizes to support the association between apoB levels and residual CV risk in statin-treated patients with chronic coronary syndrome (CCS). This limitation hinders the clinical application of apoB as a target for lipid-lowering treatment in this population.6
In this study, we aimed to conduct a prospective cohort study to evaluate the effectiveness of apoB levels in predicting adverse CV outcomes for statin-treated CCS patients.
METHODSStudy design and populationThis prospective, observational cohort study was conducted at Fuwai Hospital, Chinese Academy of Medical Sciences. From January 2017 to December 2018, a total of 10 520 statin-treated CCS patients were consecutively recruited at the hospital. Patients were eligible for inclusion if they met the following criteria: a) age 18 years or older; and b) diagnosed with CCS and treated with statins. The diagnostic criteria for CCS were based on the European Society of Cardiology guidelines for the diagnosis and management of CCS.9
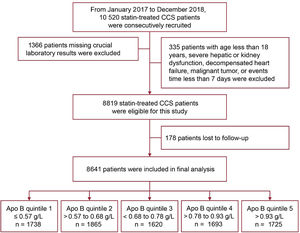
Patients were excluded if they met any of the following criteria: a) missing crucial laboratory data; b) severe liver or kidney dysfunction; c) decompensated heart failure; d) malignant tumor; e) event time less than 7 days; or f) lost to follow-up. After applying these criteria, 8 641 eligible patients were included in the study. The details of the enrollment process are illustrated in figure 1.
The study protocol complied with the Declaration of Helsinki and was approved by the Fuwai Hospital Ethics Review Committee. All patients provided written informed consent before enrollment. This study followed the Strengthening the Reporting of Observational Studies in Epidemiology (STROBE) reporting guideline.10
Data collection and definitionsAll treatments and coronary angiography procedures were performed in accordance with international guidelines and at the discretion of the treating cardiologist. Angiographic and procedural data were independently collected from catheter laboratory records by 2 trained interventional cardiologists. Demographic and clinical data were collected prospectively by independent research personnel using standardized questionnaires.
Diabetes was defined as a prior physician diagnosis of diabetes, fasting plasma glucose (FPG) ≥ 126mg/dL (7.0 mmoL/L), glycated hemoglobin A1c (HbA1c) ≥ 6.5%, 2-hour blood glucose during an oral glucose tolerance test (OGTT) ≥ 200mg/dL (11.1 mmoL/L), or the use of hypoglycemic medications.11 Hypertension was defined as systolic blood pressure ≥ 140mmHg, diastolic blood pressure ≥ 90mmHg, or the use of antihypertensive therapy.12
Laboratory measurementsOn admission, venous blood samples were collected from each participant after at least 12hours of fasting. All examinations were conducted at the core laboratory of Fuwai Hospital. Concentrations of apoB, apolipoprotein A1, and lipoprotein(a) were measured using an immunoturbidimetric method. Serum levels of FPG, hemoglobin A1c, creatinine, high-sensitivity C-reactive protein, and lipid profiles (including triglycerides, total cholesterol, LDL-C, and high-density lipoprotein cholesterol [HDL-C]) were assessed using standard laboratory techniques. Non-HDL-C was calculated as total cholesterol minus HDL-C. The estimated glomerular filtration rate (eGFR) was calculated using the Chinese-modified MDRD (Modification of Diet in Renal Disease) equation.13
Follow-up and study endpointsAfter discharge, patients were followed up at 1, 6, and 12 months, and then annually until December 2021. Endpoint data were collected by trained investigators through telephone interviews using structured questionnaires and/or from clinical visit records.
The primary endpoint was CV events at the 3-year follow-up, defined as a composite of CV death, nonfatal myocardial infarction (MI), and nonfatal stroke. Secondary endpoints included major adverse cardiac events (a composite of CV death and nonfatal MI) and CV death. Unless a clear noncardiovascular cause could be established, all deaths were considered CV-related. The diagnosis of MI was determined based on clinical and laboratory criteria according to the fourth universal definition of MI. Stroke was defined as a new focal neurological deficit lasting more than 24hours, confirmed by neurologists using imaging data. All events were independently adjudicated by 2 professional clinicians who were blinded to the study; any disagreements were resolved by consulting a third experienced expert.
Statistical analysisContinuous variables were reported as mean±standard deviation or median [interquartile range (IQR)] and were compared using the Student's t-test or the Mann-Whitney U test, as appropriate. Categorical variables were expressed as numbers and percentages and were compared using the chi-square test or Fisher exact test, as appropriate.
The cumulative incidence of study endpoints among the 5 groups was illustrated using Kaplan-Meier curves and compared with the log-rank test. Univariable and multivariable Cox proportional hazards analyses were performed to investigate the association between apoB levels and study endpoints, with the apoB quintile 3 group serving as the reference. Hazard ratios (HRs) with 95% confidence intervals (95%CIs) were reported. Covariates included in the multivariable models were age, male sex, body mass index (BMI), previous MI, previous revascularization, hypertension, diabetes, previous stroke, current smoking, peripheral artery disease, left ventricular ejection fraction, triglycerides, HDL-C), high-sensitivity C-reactive protein, estimated glomerular filtration rate, lipoprotein(a), three-vessel disease, chronic total occlusion (CTO) lesions, aspirin use, clopidogrel use, and angiotensin-converting enzyme inhibitor/angiotensin II receptor blocker use.
Restricted cubic spline analyses with 5 knots, located at the 5th, 27.5th, 50th, 72.5th, and 95th centiles, were used to explore the association between apoB levels and study endpoints at the 3-year follow-up. These models were adjusted for the same covariates mentioned above. Given that the associations of apoB with study endpoints were approximately log -linear both below and above its median value (0.73g/L in the overall population), we also used a linear model to calculate HRs per standard deviation increase in apoB levels. Additionally, sensitivity analyses were performed to assess the robustness of our findings.
Cox logistic least absolute shrinkage and selection operator (LASSO) regressions were used to select variables from the variable pool for the study endpoints. The LASSO Cox model is a regularization technique that enhances the predictive performance and interpretability of the Cox proportional hazards model by imposing a penalty on the absolute size of the regression coefficients.14 This penalty helps to shrink some coefficients to zero, effectively performing variable selection and identifying the most relevant predictors.14
To accurately assess the impact of apoB compared with LDL-C, we followed the following steps. Given the high correlation between apoB and LDL-C, we first performed a regression analysis of apoB on LDL-C.15 The residuals from this regression, representing the portion of apoB not explained by LDL-C, were then included in the multivariable Cox regression models.15 Additional sensitivity analyses were conducted to evaluate the potential impact of non-CV mortality as a competing risk.16
Finally, we analyzed the associations between apoB quintiles and CV events, considering several factors including age (< 65 and ≥ 65 years), sex, diabetes status, hypertension status, and LDL-C levels (≤ median or > median). We calculated P for interaction for all subgroup analyses.
A 2-way P value <.05 was considered statistically significant. All analyses were performed using R software version 4.1.2 (R Foundation for Statistical Computing, Vienna, Austria).
RESULTSBaseline characteristicsA total of 8641 statin-treated CCS patients were included in the study. The mean age of the overall population was 59.38±9.95 years, and 6777 (78.4%) patients were men. Among the included patients, 6250 (72.3%) patients had been diagnosed with hypertension, 3795 (43.9%) had diabetes, and 2446 (28.3%) were current smokers. The study population was subsequently divided into 5 groups based on apoB quintiles: quintile 1 (apoB ≤ 0.57g/L, n=1738), quintile 2 (apoB levels of >0.57-0.68g/L, n=1865), quintile 3 (apoB levels of >0.68-0.78g/L, n=1620), quintile 4 (apoB levels of >0.78-0.93g/L, n=1693), and quintile 5 (apoB levels of >0.93g/L, n=1725) (figure 1).
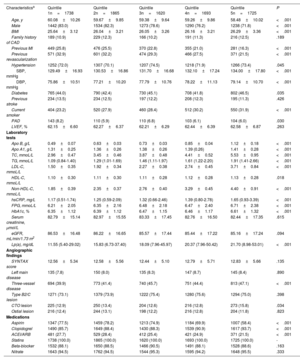
Baseline characteristics according to apoB quintiles are presented in table 1. Patients in quintile 1 (apoB levels of ≤ 0.57g/L) were older, more likely to be male, and had a higher prevalence of previous MI, previous revascularization, hypertension, diabetes and peripheral artery disease. Patients in quintile 5 (apoB levels of >0.93g/L) had higher BMI and were more likely to have hypertension and diabetes and be current smokers (all P <.05). Moreover, the results of laboratory tests showed that levels of apo A1, total cholesterol, triglycerides, LDL-C, HDL-C, non-HDL-C, high-sensitivity C-reactive protein, FPG, hemoglobin A1c, and lipoprotein(a) levels consistently increased with apoB quintiles (all P <.05). Furthermore, 3-vessel lesions and CTO lesions were more frequently observed in patients with higher apoB levels (both P <.05).
Baseline characteristics stratified by apoB levels
| Characteristicsa | Quintile 1n=1738 | Quintile 2n=1865 | Quintile 3n=1620 | Quintile 4n=1693 | Quintile 5n=1725 | P |
|---|---|---|---|---|---|---|
| Age, y | 60.08±10.26 | 59.67±9.85 | 59.38±9.64 | 59.26±9.86 | 58.48±10.02 | <.001 |
| Male | 1442 (83.0) | 1534 (82.3) | 1273 (78.6) | 1290 (76.2) | 1238 (71.8) | <.001 |
| BMI | 25.64±3.12 | 26.04±3.21 | 26.05±3.26 | 26.16±3.21 | 26.29±3.36 | <.001 |
| Family history of CAD | 189 (10.9) | 229 (12.3) | 166 (10.2) | 191 (11.3) | 216 (12.5) | .189 |
| Previous MI | 449 (25.8) | 476 (25.5) | 370 (22.8) | 355 (21.0) | 281 (16.3) | <.001 |
| Previous revascularization | 571 (32.9) | 601 (32.2) | 474 (29.3) | 466 (27.5) | 371 (21.5) | <.001 |
| Hypertension | 1252 (72.0) | 1307 (70.1) | 1207 (74.5) | 1218 (71.9) | 1266 (73.4) | .045 |
| SBP, mmHg | 129.49±16.93 | 130.53±16.86 | 131.70±16.68 | 132.10±17.24 | 134.00±17.80 | <.001 |
| DBP, mmHg | 75.86±10.51 | 77.21±10.20 | 77.79±10.76 | 78.22±11.13 | 79.14±10.70 | <.001 |
| Diabetes | 765 (44.0) | 790 (42.4) | 730 (45.1) | 708 (41.8) | 802 (46.5) | .035 |
| Previous stroke | 234 (13.5) | 234 (12.5) | 197 (12.2) | 208 (12.3) | 195 (11.3) | .426 |
| Current smoker | 404 (23.2) | 520 (27.9) | 460 (28.4) | 512 (30.2) | 550 (31.9) | <.001 |
| PAD | 143 (8.2) | 110 (5.9) | 110 (6.8) | 103 (6.1) | 104 (6.0) | .030 |
| LVEF, % | 62.15±6.60 | 62.27±6.37 | 62.21±6.29 | 62.44±6.39 | 62.58±6.87 | .263 |
| Laboratory tests | ||||||
| Apo B, g/L | 0.49±0.07 | 0.63±0.03 | 0.73±0.03 | 0.85±0.04 | 1.12±0.18 | <.001 |
| Apo A1, g/L | 1.31±0.25 | 1.36±0.26 | 1.38±0.26 | 1.39 (0.26) | 1.41±0.28 | <.001 |
| TC, mmoL/L | 2.96±0.47 | 3.45±0.46 | 3.87±0.48 | 4.41±0.52 | 5.53±0.95 | <.001 |
| TG, mmoL/L | 1.09 (0.84-1.40) | 1.29 (1.01-1.69) | 1.46 (1.11-1.97) | 1.61 (1.22-2.20) | 1.91 (1.41-2.66) | <.001 |
| LDL-C, mmoL/L | 1.50±0.35 | 1.92±0.34 | 2.27±0.38 | 2.74±0.45 | 3.71±0.84 | <.001 |
| HDL-C, mmoL/L | 1.10±0.30 | 1.11±0.30 | 1.11±0.28 | 1.12±0.28 | 1.13±0.28 | .018 |
| Non-HDL-C, mmoL/L | 1.85±0.39 | 2.35±0.37 | 2.76±0.40 | 3.29±0.45 | 4.40±0.91 | <.001 |
| hsCRP, mg/L | 1.17 (0.51-1.74) | 1.25 (0.59-2.09) | 1.32 (0.66-2.46) | 1.39 (0.80-2.78) | 1.65 (0.93-3.39) | <.001 |
| FPG, mmoL/L | 6.21±2.05 | 6.35±2.16 | 6.48±2.18 | 6.47±2.40 | 6.71±2.38 | <.001 |
| HbA1c, % | 6.35±1.12 | 6.39±1.12 | 6.47±1.15 | 6.46±1.17 | 6.61±1.32 | <.001 |
| Serum creatinine, μmol/L | 82.79±15.14 | 82.97±15.55 | 83.33±17.45 | 82.76±16.50 | 82.44±17.35 | .615 |
| eGFR, mL/min/1.73 m2 | 86.53±16.48 | 86.22±16.65 | 85.57±17.44 | 85.44±17.22 | 85.16±17.24 | .094 |
| Lp(a), mg/dL | 11.55 (5.40-29.02) | 15.83 (6.73-37.40) | 18.09 (7.96-45.97) | 20.37 (7.96-50.42) | 21.70 (8.98-53.01) | <.001 |
| Angiographic findings | ||||||
| SYNTAX score | 12.56±5.34 | 12.58±5.56 | 12.44±5.10 | 12.79±5.71 | 12.83±5.66 | .135 |
| Left main disease | 135 (7.8) | 150 (8.0) | 135 (8.3) | 147 (8.7) | 145 (8.4) | .890 |
| Three-vessel disease | 694 (39.9) | 773 (41.4) | 740 (45.7) | 751 (44.4) | 813 (47.1) | <.001 |
| Type B2/C lesion | 1271 (73.1) | 1379 (73.9) | 1222 (75.4) | 1280 (75.6) | 1294 (75.0) | .398 |
| CTO lesion | 225 (12.9) | 250 (13.4) | 204 (12.6) | 216 (12.8) | 273 (15.8) | .034 |
| Ostial lesion | 216 (12.4) | 244 (13.1) | 198 (12.2) | 216 (12.8) | 204 (11.8) | .823 |
| Medications | ||||||
| Aspirin | 1347 (77.5) | 1459 (78.2) | 1213 (74.9) | 1184 (69.9) | 1007 (58.4) | <.001 |
| Clopidogrel | 1490 (85.7) | 1649 (88.4) | 1430 (88.3) | 1539 (90.9) | 1617 (93.7) | <.001 |
| ACEI/ARB | 481 (27.7) | 529 (28.4) | 412 (25.4) | 421 (24.9) | 371 (21.5) | <.001 |
| Statins | 1738 (100.0) | 1865 (100.0) | 1620 (100.0) | 1693 (100.0) | 1725 (100.0) | - |
| Beta-blocker | 1532 (88.1) | 1650 (88.5) | 1466 (90.5) | 1491 (88.1) | 1528 (88.6) | .163 |
| Nitrate | 1643 (94.5) | 1762 (94.5) | 1544 (95.3) | 1595 (94.2) | 1648 (95.5) | .333 |
ACEI, angiotensin-converting enzyme inhibitor; ApoA1, apolipoprotein A1; ApoB, apolipoprotein B; ARB, angiotensin II receptor blocker; BMI, body mass index; CAD, coronary artery disease; CTO, chronic total occlusion; DBP; diastolic blood pressure; eGFR, estimated glomerular filtration rate; FPG, fasting plasma glucose; HbA1c, hemoglobin A1c; HDL-C, high-density lipoprotein cholesterol; hsCRP, high-sensitivity C-reactive protein; LDL-C, low-density lipoprotein cholesterol; Lp(a), lipoprotein(a); LVEF, left ventricular ejection fraction; MI, myocardial infarction; PAD, peripheral artery disease; SBP, systolic blood pressure; SYNTAX, synergy between percutaneous coronary intervention with taxus and cardiac surgery; TC, total cholesterol; TG, triglyceride.
The correlation analyses showed that apoB levels were strongly and positively associated with total cholesterol (correlation coefficient=0.891, P <.001), LDL-C (correlation coefficient=0.901, P <.001), and non-HDL-C levels (correlation coefficient=0.917, P <.001). In addition, apoB levels were positively correlated with BMI, systolic blood pressure, diastolic blood pressure, left ventricular ejection fraction, apolipoprotein A1, triglycerides, HDL-C, high-sensitivity C-reactive protein, FPG, hemoglobin A1c, and lipoprotein(a). Conversely, apoB levels were inversely correlated with age and estimated glomerular filtration rate (table 1 of the supplementary data; all P <.05).
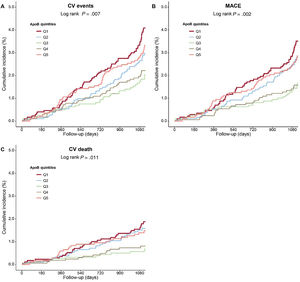
Apolipoprotein B levels and cardiovascular outcomesThe median length of follow-up was 3.17 [3.01 to 3.32] years. In the overall cohort, 232 (2.7%) CV events were recorded, including 105 cases of CV death, 76 cases of nonfatal MI, 37 cases of nonfatal stroke, and 161 (1.9%) fatal events. Rates of study endpoints according to apoB quintiles are listed in table 2 of the supplementary data. Kaplan-Meier survival analyses showed a significant difference in the incidence of CV events, major adverse cardiac events, and CV death among the 5 groups at 3-year follow-ups, with the lowest rate of adverse clinical events in quintile 3 (figure 2, all P values <.05).
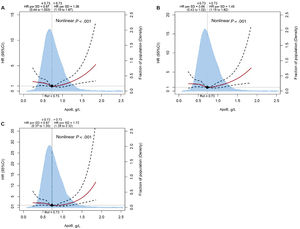
Figure 3 illustrates the fully adjusted association between apoB on a continuous scale and the 3-year risk of study endpoints using restricted cubic spline analysis. There were J-shaped associations between apoB and study endpoints at the 3-year follow-up after adjustment for confounding factors (all nonlinear P values <.05). The risks of CV events, major adverse cardiac events and CV death remained relatively flat until apoB levels reached approximately 0.73g/L, after which they began to increase rapidly.
Restricted cubic spline analysis for apoB levels and (A) CV events, (B) MACE, and (C) CV death. CV events included CV death, nonfatal MI, and nonfatal stroke. MACE included CV death and nonfatal MI. All restricted cubic spline analyses were adjusted for age, male sex, body mass index, previous MI, previous revascularization, hypertension, diabetes, previous stroke, current smoking, peripheral artery disease, left ventricular ejection fraction, triglycerides, high-density lipoprotein cholesterol, high-sensitivity C-reactive protein, estimated glomerular filtration rate, lipoprotein(a), 3-vessel disease, chronic total occlusion lesions, aspirin use, clopidogrel use, and angiotensin-converting enzyme inhibitor/angiotensin II receptor blocker use. 95%CI, 95% confidence interval; apoB, apolipoprotein B; CV, cardiovascular; HR, hazard ratio; MACE, major adverse cardiac events; MI, myocardial infarction; SD, standard deviation.
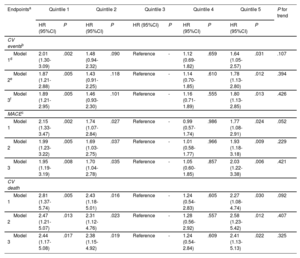
Cox regression analyses were conducted to investigate the relationships between apoB levels and cardiovascular (CV) outcomes, with results detailed in table 2. The fully adjusted models revealed that both apoB quintile 1 and quintile 5 groups had an increased risk of CV events, major adverse cardiac events, and CV death at the 3-year follow-up (all P values <.05).
Cox proportional hazard analyses for apoB quintiles with adverse CV events at 3-year follow-up
| Endpointsa | Quintile 1 | Quintile 2 | Quintile 3 | Quintile 4 | Quintile 5 | P for trend | |||||
|---|---|---|---|---|---|---|---|---|---|---|---|
| HR (95%CI) | P | HR (95%CI) | P | HR (95%CI) | P | HR (95%CI) | P | HR (95%CI) | P | ||
| CV eventsb | |||||||||||
| Model 1d | 2.01 (1.30-3.09) | .002 | 1.48 (0.94-2.32) | .090 | Reference | - | 1.12 (0.69-1.82) | .659 | 1.64 (1.05-2.57) | .031 | .107 |
| Model 2e | 1.87 (1.21-2.88) | .005 | 1.43 (0.91-2.25) | .118 | Reference | - | 1.14 (0.70-1.85) | .610 | 1.78 (1.13-2.80) | .012 | .394 |
| Model 3f | 1.89 (1.21-2.95) | .005 | 1.46 (0.93-2.30) | .101 | Reference | - | 1.16 (0.71-1.89) | .555 | 1.80 (1.13-2.85) | .013 | .426 |
| MACEc | |||||||||||
| Model 1 | 2.15 (1.33-3.47) | .002 | 1.74 (1.07-2.84) | .027 | Reference | - | 0.99 (0.57-1.74) | .986 | 1.77 (1.08-2.91) | .024 | .052 |
| Model 2 | 1.99 (1.23-3.22) | .005 | 1.69 (1.03-2.75) | .037 | Reference | - | 1.01 (0.58-1.77) | .966 | 1.93 (1.18-3.18) | .009 | .229 |
| Model 3 | 1.95 (1.19-3.19) | .008 | 1.70 (1.04-2.78) | .035 | Reference | - | 1.05 (0.60-1.85) | .857 | 2.03 (1.22-3.38) | .006 | .421 |
| CV death | |||||||||||
| Model 1 | 2.81 (1.37-5.74) | .005 | 2.43 (1.18-5.01) | .016 | Reference | - | 1.24 (0.54-2.83) | .605 | 2.27 (1.08-4.74) | .030 | .092 |
| Model 2 | 2.47 (1.21-5.07) | .013 | 2.31 (1.12-4.76) | .023 | Reference | - | 1.28 (0.56-2.92) | .557 | 2.58 (1.23-5.42) | .012 | .407 |
| Model 3 | 2.44 (1.17-5.08) | .017 | 2.38 (1.15-4.92) | .019 | Reference | - | 1.24 (0.54-2.84) | .609 | 2.41 (1.13-5.13) | .022 | .325 |
95%CI, 95% confidence interval; apoB, apolipoprotein B; ACEI, angiotensin-converting enzyme inhibitor; ARB, angiotensin II receptor blocker; BMI, body mass index; CTO, chronic total occlusion; CV, cardiovascular; eGFR, estimated glomerular filtration rate; HDL-C, high-density lipoprotein cholesterol; HR, hazard ratio; hsCRP, high-sensitivity C-reactive protein; LDL-C, low-density lipoprotein cholesterol; Lp(a), lipoprotein(a); LVEF, left ventricular ejection fraction; MACE, major adverse cardiac events; MI, myocardial infarction; PAD, peripheral artery disease; TG, triglyceride.
To test the robustness of the J-shaped association between apoB and CV outcomes, we further conducted sensitivity analyses, using Cox LASSO regression to select variables for multivariable adjustment. Consequently, we identified 3 sets of variables for the corresponding 3 study endpoints (table 3 of the supplementary data and figure 1 of the supplementary data). For CV events, we adjusted for age, BMI, previous MI, prior revascularization, peripheral artery disease, left ventricular ejection fraction, apolipoprotein A1, triglycerides, hemoglobin A1c, creatinine, nitrate use, and clopidogrel use. For major adverse cardiac events, we adjusted for age, BMI, previous MI, prior revascularization, current smoking, peripheral artery disease, left ventricular ejection fraction, apolipoprotein A1, triglycerides, high-sensitivity C-reactive protein, hemoglobin A1c, creatinine, left main disease, nitrate use, and clopidogrel use. For CV death, we adjusted for age, BMI, diastolic blood pressure, previous stroke, peripheral artery disease, left ventricular ejection fraction, apolipoprotein A1, creatinine, CTO lesions, and clopidogrel use. Consistent with the main findings, restricted cubic spline analyses and multivariable Cox regression models using the variables selected by Cox LASSO regression revealed J-shaped associations between apoB and 3-year adverse clinical events (table 4 of the supplementary data and figure 2 of the supplementary data).
ApoB residuals (representing apoB levels not explained by LDL-C) were significantly associated with CV events and major adverse cardiac events after multivariable adjustment. Both the lowest (quintile 1) and highest (quintile 5) apoB residual quintile groups had an increased risk of CV events and major adverse cardiac events (table 5 of the supplementary data). The results of the competing risk analyses considering risks of non-CV death (table 6 of the supplementary data) were identical to those presented in table 2.
Subgroup analysisSubgroup analyses were performed to evaluate the association between apoB quintiles and CV events in different populations based on age (< or ≥ 65 years), sex, diabetes, hypertension, diabetes mellitus, and LDL-C levels (<2.25 mmoL/L or ≥ 2.25 mmoL/L). The association between apoB quintiles and CV events risk was consistent among the different subgroups, with comparable interactions (all P >.05 for interaction) (table 7 of the supplementary data).
DISCUSSIONThis large-scale prospective cohort study investigated the association between apoB levels and 3-year CV outcomes in statin-treated CCS patients. Our major findings were as follows: a) the clinical and angiographic profiles of statin-treated CCS patients vary substantially among apoB quintiles, with patients having low apoB levels being more likely to be older males with a higher prevalence of previous MI, hypertension, diabetes, and peripheral artery disease; b) restricted cubic spline analysis revealed a J-shaped association between apoB levels and 3-year CV events, with the risk remaining flat until apoB levels exceed 0.73g/L, after which the risk increased (figure 4); c) in the multivariable Cox regression analysis with quintiles, the results suggested that both low and high levels of apoB are associated with increased risk compared with the middle quintile (figure 4); d) the CV risk associated with low apoB levels was driven mainly by increased CV mortality.
Lipid modification targeting LDL-C, such as statins, has been proven to reduce adverse CV events in patients with established CV disease.17 However, even with intensified statin treatments, many individuals still have substantial residual risks for adverse CV events.5,18 Beyond LDL-C, several lipid biomarkers have been developed to evaluate residual CV risk, especially apoB.19,20 Since each atherogenic particle includes 1 molecule of apoB, concentrations of apoB are considered a direct indicator of the total quantity of lipoproteins that contribute to CV disease.3,21 In individuals with low LDL-C levels, LDL-C calculation may be inaccurate, whereas apoB can provide a precise estimate of the total concentration of atherogenic particles in this context.3 Therefore, measuring apoB levels may be suitable for assessing residual CV risk in patients undergoing lipid-lowering therapy.
A few studies have explored the association between apoB and residual CV risk in different populations. For the general population, Johannesen et al.20 recruited 13 015 statin-treated individuals from the Copenhagen General Population Study with a median follow-up of 8 years. They found an elevated risk of all-cause death at both low and high apoB concentrations. However, this study included the general population, and the conclusion may not be applicable to the secondary prevention population of CAD. For patients with acute coronary syndrome (ACS), Hagström et al.19 included 18 924 patients with recent ACS treated with alirocumab or placebo from the Evaluation of Cardiovascular Outcomes After an Acute Coronary Syndrome During Treatment With Alirocumab (ODYSSEY OUTCOMES) trial and evaluated the associations between baseline apoB or apoB at 4 months and major adverse cardiac events. In the placebo group, the incidence of major adverse cardiac events increased as the baseline apoB stratum increased (all P for trend <.05). In the alirocumab group, they found the attainment of apoB levels as low as 35mg/dL could potentially decrease the residual risk associated with lipoproteins following ACS. For CCS patients treated with lipid-lowering medication, however, no study has reported the association between apoB and residual CV events. In our study, we found a J-shaped association between apoB and 3-year CV events in statin-treated CCS patients. Our results differ from those of the above-mentioned studies,19,20 likely due to differences in the study populations.
The mechanisms underlying the link between substantially lowered apoB levels and increased CV events still need to be explored. Some previous reports have linked hypobetalipoproteinemia to metabolic dysfunction-associated steatotic liver disease22,23 and, eventually, to severe end-stage liver disease, such as cirrhosis and hepatocarcinoma.24,25 Previous studies have also found that fatty liver is primarily observed in carriers of APOB loss of function (LoF) variants.26 This might be due to abnormalities in the assembly and secretion of triglyceride and very-low-density lipoprotein, which could lead to hepatic steatosis.27–29Our study, with the largest sample size to date, confirms the J-shaped association between apoB and adverse CV outcomes in statin-treated CCS patients. We found that apoB can be used as an effective biomarker to predict residual CV risk in this population. Future research and clinical practice regarding the management of residual CV risk in statin-treated patients with CCS could consider maintaining apoB levels at a reasonable level (around 0.73g/L) rather than targeting extremely low or high levels. Lipid-lowering regimens designed to address residual CV risk could be more individualized and adjusted based on personal apoB levels.
LimitationsThis study has several limitations. First, the study design was single-center, prospective, and observational, rather than a randomized controlled trial. As a result, it was not feasible to establish a definitive causal relationship between apoB and the incidence of CV events. Second, dynamic changes in apoB levels during follow-up were not presented in our study. Third, due to limitations in data collection, the study could not comprehensively evaluate all lipid-associated factors or other types of lipid-lowering drugs beyond statins. Fourth, although potential confounders were controlled for as covariates in multivariable regression models, the impact of uncollected confounders cannot be completely disregarded. Consequently, larger-scale studies are needed to validate the findings of this study.
CONCLUSIONSOur study indicated an elevated CV risk at both low and high levels of apoB, with a more significant CV risk observed at higher levels (> 0.73g/L). Larger multicenter studies should be conducted to evaluate the predictive value of apoB in statin-treated CCS patients. Furthermore, further investigation into the underlying mechanisms is needed.
- •
Lipid modification targeting LDL-C has been proven to reduce adverse CV events in patients with established CV disease.
- •
Beyond LDL-C, several lipid biomarkers have been developed to evaluate residual CV risk, especially apoB.
- •
Since each atherogenic particle contains 1 molecule of apoB, concentrations of apoB are considered a direct indicator of the total quantity of lipoproteins contributing to CV disease.
- •
Restricted cubic spline analysis found a J-shaped association between apoB and 3-year CV events, with the risk remaining flat until apoB levels exceed 0.73g/L, after which the risk increases.
- •
Multivariable Cox regression models found that both low and high apoB levels were associated with a higher risk of CV events at 3 years of follow-up.
- •
The CV risk associated with low apoB was driven mainly by increased CV mortality.
This study was supported by Chinese Academy of Medical Sciences Innovation Fund for Medical Sciences (CIFMS) (2021-I2M-1-008).
ETHICAL CONSIDERATIONSThe study protocol complied with the Declaration of Helsinki and was approved by the Fuwai Hospital Ethics Review Committee. All study patients provided written informed consent before enrollment. This study adhered to the Strengthening the Reporting of Observational Studies in Epidemiology (STROBE) reporting guideline.
STATEMENT ON THE USE OF ARTIFICIAL INTELLIGENCENo artificial intelligence was used in the preparation of this article.
AUTHORS’ CONTRIBUTIONSJ. He and Z. Lin contributed equally to this work. K. Dou, J. He, and Z. Lin performed study design, researched data, contributed to discussion, and wrote, reviewed, and edited the manuscript. J. He and Z. Lin acquired the data and revised the intellectual content of the manuscript. C. Song and S. Yuan curated data and figures. X. Bian and B. Li reviewed and edited the manuscript. All authors approved the final version of the manuscript. K. Dou, W. Ma, J. He, and Z. Lin are the guarantors of this work and, as such, had full access to all the data in the study and take responsibility for the integrity of the data and the accuracy of the data analysis.
CONFLICTS OF INTERESTNone.