Type 2 diabetes mellitus is commonly associated with hypertension and dyslipidemia. These disorders are risk factors for left ventricular (LV) remodeling, which represents one of the preconditions for the development of heart failure.1 Several studies using 2-dimensional (2D) speckle tracking have shown that LV myocardial deformation is also impaired in diabetic patients.2–4 To our knowledge, no research has comprehensively investigated 2D and 3-dimensional (3D) left heart deformation in persons with prediabetes and diabetes.
Our goal was to investigate LV and left atrial (LA) deformation in prediabetic and diabetic persons using 2D and 3D strain, and to examine the relationship between left heart mechanics and parameters of glycemic control in this population.
Our study included 114 untreated persons aged < 65 years, divided into 3 groups: 38 persons with prediabetes, 38 recently diagnosed diabetic patients, and 38 healthy participants free of cardiovascular risk factors. In line with current guidelines, prediabetes and diabetes were defined by levels of fasting blood glucose and glycated hemoglobin (HbA1c). Participants in all 3 groups were matched by sex and age.
All participants underwent a complete 2D and 3D echocardiographic examination using a Vivid 7 ultrasound machine. The 2D LV and LA longitudinal strain was calculated by averaging all the values of the regional peak longitudinal strain obtained in 2-chamber and 4-chamber apical views. The 2D LV circumferential strain and radial strain were obtained as the average of the LV 6 regional values measured at the level of the papillary muscles. The 3D LV mechanical parameters, global longitudinal, circumferential, radial and area strain were calculated as the averages of the regional values from the 17 myocardial segments at end-systole.
A multivariate regression analysis included body mass index, transmitral E/A ratio, 2D LV and LA longitudinal strain, 2D LV mass index, and 3D LV area strain.
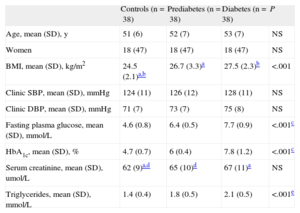
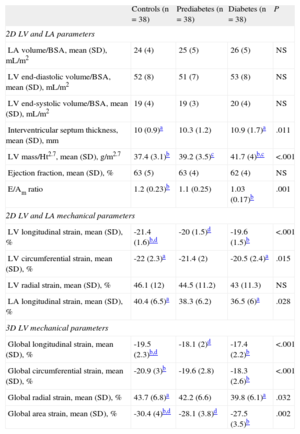
The results showed that there was no difference in blood pressure levels between the observed groups, whereas fasting glucose levels and HbA1c progressively increased from the controls to the diabetic patients (Table 1). The LV mass index was greater in diabetic patients than in controls and persons with prediabetes (Table 2). LV diastolic function estimated by transmitral E/A ratio was significantly impaired in diabetic patients compared with controls (Table 2).
Demographic Characteristics and Clinical Parameters of Study Population
| Controls (n=38) | Prediabetes (n=38) | Diabetes (n=38) | P | |
| Age, mean (SD), y | 51 (6) | 52 (7) | 53 (7) | NS |
| Women | 18 (47) | 18 (47) | 18 (47) | NS |
| BMI, mean (SD), kg/m2 | 24.5 (2.1)a,b | 26.7 (3.3)a | 27.5 (2.3)b | <.001 |
| Clinic SBP, mean (SD), mmHg | 124 (11) | 126 (12) | 128 (11) | NS |
| Clinic DBP, mean (SD), mmHg | 71 (7) | 73 (7) | 75 (8) | NS |
| Fasting plasma glucose, mean (SD), mmol/L | 4.6 (0.8) | 6.4 (0.5) | 7.7 (0.9) | <.001c |
| HbA1c, mean (SD), % | 4.7 (0.7) | 6 (0.4) | 7.8 (1.2) | <.001c |
| Serum creatinine, mean (SD), umol/L | 62 (9)a,d | 65 (10)d | 67 (11)a | NS |
| Triglycerides, mean (SD), mmol/L | 1.4 (0.4) | 1.8 (0.5) | 2.1 (0.5) | <.001e |
BMI, body mass index; DBP, diastolic blood pressure; HbA1c, glycated hemoglobin; SBP, systolic blood pressure; SD, standard deviation.
Echocardiographic Parameters of the Left Ventricle and Left Atrium in the Study Population (2- and 3-Dimensional Echocardiography Assessment)
| Controls (n=38) | Prediabetes (n=38) | Diabetes (n=38) | P | |
| 2D LV and LA parameters | ||||
| LA volume/BSA, mean (SD), mL/m2 | 24 (4) | 25 (5) | 26 (5) | NS |
| LV end-diastolic volume/BSA, mean (SD), mL/m2 | 52 (8) | 51 (7) | 53 (8) | NS |
| LV end-systolic volume/BSA, mean (SD), mL/m2 | 19 (4) | 19 (3) | 20 (4) | NS |
| Interventricular septum thickness, mean (SD), mm | 10 (0.9)a | 10.3 (1.2) | 10.9 (1.7)a | .011 |
| LV mass/Ht2.7, mean (SD), g/m2.7 | 37.4 (3.1)b | 39.2 (3.5)c | 41.7 (4)b,c | <.001 |
| Ejection fraction, mean (SD), % | 63 (5) | 63 (4) | 62 (4) | NS |
| E/Am ratio | 1.2 (0.23)b | 1.1 (0.25) | 1.03 (0.17)b | .001 |
| 2D LV and LA mechanical parameters | ||||
| LV longitudinal strain, mean (SD), % | -21.4 (1.6)b,d | -20 (1.5)d | -19.6 (1.5)b | <.001 |
| LV circumferential strain, mean (SD), % | -22 (2.3)a | -21.4 (2) | -20.5 (2.4)a | .015 |
| LV radial strain, mean (SD), % | 46.1 (12) | 44.5 (11.2) | 43 (11.3) | NS |
| LA longitudinal strain, mean (SD), % | 40.4 (6.5)a | 38.3 (6.2) | 36.5 (6)a | .028 |
| 3D LV mechanical parameters | ||||
| Global longitudinal strain, mean (SD), % | -19.5 (2.3)b,d | -18.1 (2)d | -17.4 (2.2)b | <.001 |
| Global circumferential strain, mean (SD), % | -20.9 (3)b | -19.6 (2.8) | -18.3 (2.6)b | <.001 |
| Global radial strain, mean (SD), % | 43.7 (6.8)a | 42.2 (6.6) | 39.8 (6.1)a | .032 |
| Global area strain, mean (SD), % | -30.4 (4)b,d | -28.1 (3.8)d | -27.5 (3.5)b | .002 |
Am, late diastolic mitral flow (pulse Doppler); 2D, 2-dimensional; 3D, 3-dimensional; BSA,body surface area; E, early diastolic mitral flow (pulse Doppler); Ht, height; LA, left atrium; LV, left ventricle; SD, standard deviation.
Two- and 3D LV longitudinal mechanical function was increased in the controls compared with the other 2 groups. Two- and 3D LV circumferential, together with 2D LA longitudinal strain were decreased in the diabetic patients compared with controls. Two-dimensional LV radial strain did not differ between the 3 groups, whereas 3D LV radial strain was lower in diabetic patients than in controls (Table 2). Three-dimensional LV area strain was lower in the prediabetic and diabetic patients than in the controls (Table 2).
The multivariate regression analysis demonstrated that 2D LV mass index (β=0.38; P<.01), 2D LA longitudinal strain (β=-0.3; P=.01) and 3D LV area strain (β=-0.37; P<.01) were independently associated with HbA1c in the whole study population.
Our investigation revealed several new findings: a) 3D LV myocardial deformation in all directions is deteriorated in diabetic patients; b) prediabetic patients have decreased 2D LV longitudinal strain, as well as 3D longitudinal and area strain; c) 2D LA longitudinal strain is decreased in diabetic patients; and d) 2D and 3D parameters of left heart mechanics are independently associated with glycemic control, assessed by HbA1c.
Recently published studies have shown that 2D LV and LA strain are strong predictors of cardiovascular morbidity and mortality in the general population and in diabetic patients. Ernande et al2,4 showed that 2D longitudinal and radial functions of each LV segment are impaired in diabetic participants; Ng et al3 found that only 2D longitudinal deformation was reduced in diabetic patients, whereas circumferential and radial strain were preserved. Ceyhan et al5 have published the first report that persons with impaired glucose tolerance have decreased LV systolic strain and strain rate, as well as early diastolic strain rate compared with controls. Our results confirm previous findings and add a new piece of evidence: namely, we found that 2D LV circumferential strain, in addition to longitudinal function, is also deteriorated in diabetic patients. Additionally, 3D speckle tracking revealed that LV mechanical deformation is impaired in all directions, along with area strain, which represents a combination of longitudinal and circumferential strain. Our findings demonstrate that LV systolic function, together with diastolic function, is impaired long before the occurrence of cardiac symptoms.
Zhang et al6 showed that well-controlled diabetic patients have a decreased 3D strain in all directions, which completely confirms our results. The authors also found that HbA1c was independently associated with all components of 3D LV strain. Our model of stepwise multivariate regression was different, and revealed that 2D LV and LA longitudinal strain, as well as 3D LV area strain, were independently associated with HbA1c.
Further analyses are necessary to evaluate the predictive value of 2D, and especially of 3D strain, on cardiovascular morbidity and mortality in prediabetic and diabetic patients.


