The aim of this study was to assess the prevalence of excess weight and abdominal obesity (AO), based on individual anthropometric measurements, according to various criteria in the Spanish population aged 3 to 24 years and to analyze their distribution by age and sex.
MethodsWe analyzed data from the ENPE study. This analysis included the population aged 3 to 24 years (n=1601). Anthropometric measurements were taken in participants’ homes by trained observers following standardized international protocols. We defined overweight and obesity according to the International Obesity Task Force, World Health Organization, and Orbegozo 2011 criteria, and AO according to a waist-to-height index ≥ 0.5, Taylor criteria, and the 90th percentile of Orbegozo 2011.
ResultsThe prevalence of excess weight (overweight+obesity) exceeded 30% with all the criteria used. The prevalence of excess overweight (International Obesity Task Force) was estimated at 34.1% (95%CI, 31.8-36.4) and obesity at 10.3% (95%CI, 8.9-11.9). The estimated prevalence of AO (waist-to-height index ≥ 0.5) was 31.2% (95%CI, 29.0-33.5), and 20.9% (95%CI, 18.1-22.1) satisfied all 3 criteria. A total of 16% (95%CI, 13.8-17.8) were overweight and had concomitant AO.
ConclusionsThe prevalence of overweight, obesity and AO in the Spanish population aged 3 to 24 years old is high and is higher in men than in women. When distinct criteria were used, the prevalence of AO was approximately 30%. Among persons classified as obese by the 3 criteria, 71.6% were also classified as having AO according to distinct cutoffs.
Keywords
Overweight and obesity in childhood are associated with a higher risk of obesity in adulthood1 and a higher risk of noncommunicable diseases (type 2 diabetes mellitus, cardiovascular disease, some types of cancer) in later stages of life.2 Abdominal obesity (AO) in pediatric patients is also associated with increased cardiometabolic risk.3
In 2012, this growing problem led the World Health Organization (WHO) to propose as an objective stopping any further increase in childhood overweight by 2025. One study4 found that trends in child and adolescent body mass index (BMI) had flattened in many high-income countries, but only at high socioeconomic levels.
It has been estimated that in Europe approximately 25% of schoolchildren have excess weight.4 The highest rates were found in Spain, Malta, Italy, the United Kingdom, and Greece. The WHO Childhood Obesity Surveillance Initiative (COSI) reported similar findings in 6 to 9–year-old children.5 In 2012, Sánchez-Cruz et al. found that the estimated prevalence of overweight in the Spanish population aged 8 to 17 years was 38.6% (WHO criteria).6 There is little information on this issue in preschoolers and schoolchildren in Europe: however, it has been suggested that the distribution of overweight and obesity is similar in the 2 groups.7 Data are available on the preschool group in some Spanish autonomous communities.8,9
The prevalence of AO is high among adolescents worldwide and is higher in developing countries.10 Little information is available on the prevalence of AO in children and young people in representative Spanish samples. The prevalence of AO in Spain has been estimated based on data from the enKiD study,11 but updated information on this issue is lacking.
There are no consensus criteria for defining AO in children. Cutoff points have been proposed for waist circumference (WC) and waist-to-height ratio (WHtR), which are indicators of abdominal adiposity associated with cardiometabolic risk in children and adolescents.12
The use of the BMI with specific cutoff points by age and sex is a well-established approach to define excess weight in children and adolescents. The use of distinct reference standards and criteria makes it difficult to compare studies and assess trends. The European Childhood Obesity Group recommends using the criteria proposed by the International Obesity Task Force (IOTF), the WHO, and other criteria adopted by other scientific bodies. It also recommends using WC, skinfolds, or bioelectrical impedance analysis according to standardized protocols whenever possible13.
The aim of this study was to assess the prevalence of excess weight and AO, based on individual anthropometric measurements, according to various criteria in Spanish population aged 3 to 24 years and to analyze their distribution by age and sex.
METHODSAn observational cross-sectional population substudy of the ENPE study14 to provide updated information on dietary consumption habits, anthropometric data, and physical activity in the Spanish community-dwelling population older than 3 years. The study was conducted in a population-based probabilistic sample selected by a random multistep procedure, described in a previous publication,14 with stratification of the units from the first step (census sections) according to autonomous community. The units of the second step consisted of the main primary residences. Individuals were selected from each home, with controlled quotas and proportional allotments according to the population density by age brackets (3-8 years, 9-18 years, 19-64 years, and > 65 years), sex, and municipality size. The scope of the study included residents whose primary residence was in Spain. Anthropometric measurements excluded persons who were unable to remain standing or were immobilized with plaster splints that could not be removed.
The sample was recruited using a procedure based on random routes (door-to-door). The data were collected between May 2014 and May 2015 by face-to-face interviews at the home of each participant. The final sample included 6800 individuals: of these, 1601 were in the age bracket of 3 to 24 years.
Anthropometric measurementsIndividual anthropometric measurements were taken by well-trained professional health interviewers with specific face-to-face training. We followed standard international procedures15 that had already been tested in a pilot study.16 The measurements were performed in triplicate with participants in the standing position, barefoot, and in lightweight clothing. Body weight was measured using a Seca 803 digital scale, height was measured using a Seca 213 portable stadiometer, and WC and hip circumference were measured using a Seca 201 nonstretch measuring tape. The instruments used, accuracy, and detailed measurement procedures are described in the supplementary data. BMI was calculated as weight (kg) divided by height (m2). The WHtR was calculated as the WC (cm) divided by height (cm). Quality controls showed that intraobserver- and interobserver-related measurement errors were less than 1% for all anthropometric parameters reported. These values were below the values considered acceptable.17
Following the recommendations of the European Childhood Obesity Group,13 excess weight was defined based on the BMI value using the WHO criteria for children younger than 5 years18 and older than 5 years,19 the IOTF criteria20,21 for international comparisons, and the criteria of the Orbegozo Foundation 2011.22 Age in months was calculated according to the date of birth and the date of examination. The procedures followed are described in more detail in the supplementary data.
We also applied the criteria used in the enKid study,23 the tables provided by the Orbegozo Foundation in 198824 (85th percentile, overweight; 97th percentile, obesity), and later versions published in 2004.25
AO was defined as WC equal to or more than the 90th percentile of the specific reference for age (in months) and sex (Orbegozo 2011 criteria).22 Taking into account the WHtR, AO was defined as a weighted mean boundary value equal to or more than 0.526 and the specific age and sex cutoff values associated with high trunk fat mass estimated by dual-energy X-ray absorpiometry as proposed by Taylor et al.27
Data analysisThe analysis was conducted in individuals aged 3 to 24 years who had full information for the variables of interest (n=1563 for BMI; n=1557 for waist and hip circumferences; 95.9%). The prevalence of obesity and AO was calculated with the respective 95% confidence interval (95%CI) according to age bracket and sex. Taking into account the sample design, confidence intervals were calculated by applying bootstrap techniques, based on 1000 samples. The sample was weighted according to the Spanish population distribution. The Student t test was used to compare mean values by sex in each age bracket and the ANOVA test was used to compare 3 or more age brackets. The chi-squared test and the z-test were used to compare the prevalence rate according to age and sex, and the McNemar test for independent samples was used to compare estimates of the prevalence of overweight, obesity, and AO according to distinct criteria. The analysis took the complex design of the sample into consideration and was conducted using the IBM SPSS v. 22.0 software package.
Ethical considerationsAll participants and the families (legal guardians) of minors were informed of the study objectives and procedures and gave written consent to participate. The final protocol was approved by the Euskadi Clinical Research Ethics Committee and was conducted in accordance with the World Medical Association's Declaration of Helsinki research involving humans. The study maintained strict confidentiality of the information provided by participants as set out in Organic Law 15/1999 of December 13 on the protection of personal data in all processes used to record and process of the obtained information.
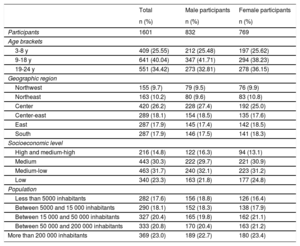
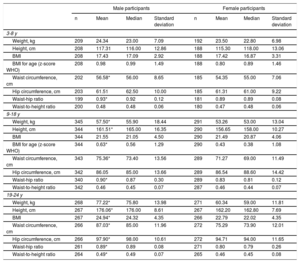
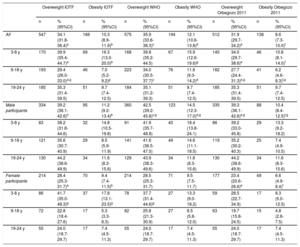
RESULTSTable 1 shows the distribution of the study group and table 2 shows the anthropometric characteristics by age bracket and sex. There were significant differences between sexes in weight and height in the younger group and in the group older than 14 years. There were no significant differences in BMI and WHtR by sex, except in the age bracket of 18 to 24 years. Significant differences were observed in WC between male and and female participants in all age brackets, except in the age bracket of 6 to 9 years.
Characteristics of the study participants
| Total | Male participants | Female participants | |
|---|---|---|---|
| n (%) | n (%) | n (%) | |
| Participants | 1601 | 832 | 769 |
| Age brackets | |||
| 3-8 y | 409 (25.55) | 212 (25.48) | 197 (25.62) |
| 9-18 y | 641 (40.04) | 347 (41.71) | 294 (38.23) |
| 19-24 y | 551 (34.42) | 273 (32.81) | 278 (36.15) |
| Geographic region | |||
| Northwest | 155 (9.7) | 79 (9.5) | 76 (9.9) |
| Northeast | 163 (10.2) | 80 (9.6) | 83 (10.8) |
| Center | 420 (26.2) | 228 (27.4) | 192 (25.0) |
| Center-east | 289 (18.1) | 154 (18.5) | 135 (17.6) |
| East | 287 (17.9) | 145 (17.4) | 142 (18.5) |
| South | 287 (17.9) | 146 (17.5) | 141 (18.3) |
| Socioeconomic level | |||
| High and medium-high | 216 (14.8) | 122 (16.3) | 94 (13.1) |
| Medium | 443 (30.3) | 222 (29.7) | 221 (30.9) |
| Medium-low | 463 (31.7) | 240 (32.1) | 223 (31.2) |
| Low | 340 (23.3) | 163 (21.8) | 177 (24.8) |
| Population | |||
| Less than 5000 inhabitants | 282 (17.6) | 156 (18.8) | 126 (16.4) |
| Between 5000 and 15 000 inhabitants | 290 (18.1) | 152 (18.3) | 138 (17.9) |
| Between 15 000 and 50 000 inhabitants | 327 (20.4) | 165 (19.8) | 162 (21.1) |
| Between 50 000 and 200 000 inhabitants | 333 (20.8) | 170 (20.4) | 163 (21.2) |
| More than 200 000 inhabitants | 369 (23.0) | 189 (22.7) | 180 (23.4) |
Participants’ anthropometric characteristics
| Male participants | Female participants | |||||||
|---|---|---|---|---|---|---|---|---|
| n | Mean | Median | Standard deviation | n | Mean | Median | Standard deviation | |
| 3-8 y | ||||||||
| Weight, kg | 209 | 24.34 | 23.00 | 7.09 | 192 | 23.50 | 22.80 | 6.98 |
| Height, cm | 208 | 117.31 | 116.00 | 12.86 | 188 | 115.30 | 118.00 | 13.06 |
| BMI | 208 | 17.43 | 17.09 | 2.92 | 188 | 17.42 | 16.87 | 3.31 |
| BMI for age (z-score WHO) | 208 | 0.98 | 0.99 | 1.49 | 188 | 0.80 | 0.89 | 1.46 |
| Waist circumference, cm | 202 | 56.58* | 56.00 | 8.65 | 185 | 54.35 | 55.00 | 7.06 |
| Hip circumference, cm | 203 | 61.51 | 62.50 | 10.00 | 185 | 61.31 | 61.00 | 9.22 |
| Waist-hip ratio | 199 | 0.93* | 0.92 | 0.12 | 181 | 0.89 | 0.89 | 0.08 |
| Waist-to-height ratio | 200 | 0.48 | 0.48 | 0.06 | 180 | 0.47 | 0.48 | 0.06 |
| 9-18 y | ||||||||
| Weight, kg | 345 | 57.50* | 55.90 | 18.44 | 291 | 53.26 | 53.00 | 13.04 |
| Height, cm | 344 | 161.51* | 165.00 | 16.35 | 290 | 156.65 | 158.00 | 10.27 |
| BMI | 344 | 21.55 | 21.05 | 4.50 | 290 | 21.49 | 20.87 | 4.06 |
| BMI for age (z-score WHO) | 344 | 0.63* | 0.56 | 1.29 | 290 | 0.43 | 0.38 | 1.08 |
| Waist circumference, cm | 343 | 75.36* | 73.40 | 13.56 | 289 | 71.27 | 69.00 | 11.49 |
| Hip circumference, cm | 342 | 86.05 | 85.00 | 13.66 | 289 | 86.54 | 88.60 | 14.42 |
| Waist-hip ratio | 340 | 0.90* | 0.87 | 0.30 | 289 | 0.83 | 0.81 | 0.12 |
| Waist-to-height ratio | 342 | 0.46 | 0.45 | 0.07 | 287 | 0.46 | 0.44 | 0.07 |
| 19-24 y | ||||||||
| Weight, kg | 268 | 77.22* | 75.80 | 13.98 | 271 | 60.34 | 59.00 | 11.81 |
| Height, cm | 267 | 176.06* | 176.00 | 8.61 | 267 | 162.20 | 162.80 | 7.69 |
| BMI | 267 | 24.94* | 24.32 | 4.35 | 266 | 22.79 | 22.02 | 4.35 |
| Waist circumference, cm | 266 | 87.03* | 85.00 | 11.96 | 272 | 75.29 | 73.90 | 12.01 |
| Hip circumference, cm | 266 | 97.90* | 98.00 | 10.61 | 272 | 94.71 | 94.00 | 11.65 |
| Waist-hip ratio | 261 | 0.89* | 0.89 | 0.08 | 271 | 0.80 | 0.79 | 0.26 |
| Waist-to-height ratio | 264 | 0.49* | 0.49 | 0.07 | 265 | 0.46 | 0.45 | 0.08 |
BMI, body mass index; WHO, World Health Organization.
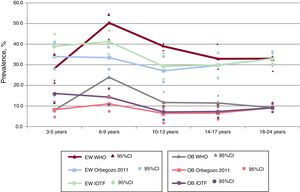
Table 3 shows the percentages of overweight and obesity by sex and age bracket according to IOTF, WHO, and Orbegozo 2011 criteria. The prevalence of excess weight (overweight+obesity) was more than 30% with all the criteria used. The estimated prevalence of overweight (IOTF criteria) was 34.1% (95%CI, 1.8-36.4) and that of obesity was 10.3% (95%CI, 8.9-11.9). The highest overall estimated prevalence of both overweight and obesity was obtained using the WHO criteria, whereas the lowest was obtained using Orbegozo 2011 criteria. The highest estimated rate of overweight and obesity was found in the age bracket of 3 to 8 years: obesity, 16.3% (95%CI, 13.0-20.0) (IOTF criteria). The highest estimated rates of overweight and obesity were obtained in males in all age brackets according to all the criteria used, except in the age bracket of 3 to 8 years according to IOTF criteria (figure 1).
Prevalence of excess weight (overweight+obesity) and obesity by age groups and sex according to the criteria proposed by the IOTF, WHO, and the Orbegozo Foundation 2011
| Overweight IOTF | Obesity IOTF | Overweight WHO | Obesity WHO | Overweight Orbegozo 2011 | Obesity Orbegozo 2011 | |||||||
|---|---|---|---|---|---|---|---|---|---|---|---|---|
| n | % (95%CI) | n | % (95%CI) | n | % (95%CI) | n | % (95%CI) | n | % (95%CI) | n | % (95%CI) | |
| All | 547 | 34.1 (31.8-36.4)a | 166 | 10.3 (8.9-11.9)b | 575 | 35.9 (33.6-38.3)c | 194 | 12.1 (10.6-13.8)d | 512 | 31.9 (29.7-34.2)e | 138 | 8.6 (7.3-10.0)f |
| 3-8 y | 170 | 39.9 (35.4-44.7)a | 69 | 16.3 (13.0-20.0)b | 168 | 39.8 (35.2-44.5) | 67 | 15.9 (12.6-19.6)g | 145 | 34.0 (29.7-38.6)e | 46 | 10.8 (8.1-14.0)f |
| 9-18 y | 193 | 29.4 (26.0-33.0)a,g | 46 | 7.0 (5.2-9.2)g | 223 | 34.0 (30.5-37.7)c | 76 | 11.6 (9.3-14.2)d | 182 | 27.7 (24.4-31.3)e,g | 41 | 6.2 (4.6-8.3)f,g |
| 19-24 y | 185 | 35.3 (31.4-39.5) | 51 | 9.7 (7.4-12.5) | 184 | 35.1 (31.2-39.3) | 51 | 9.7 (7.4-12.5) | 185 | 35.3 (31.4-39.5) | 51 | 9.7 (7.4-12.5) |
| Male participants | 334 | 39.2 (36.1-42.6)h | 95 | 11.2 (9.2-13.4)b | 360 | 42.5 (39.2-45.8)c,g | 123 | 14.5 (12.3-17.0)d,g | 335 | 39.3 (36.1-42.6)e,g | 88 | 10.4 (8.4-12.5)f,g |
| 3-8 y | 83 | 38.2 (31.8-44.6) | 32 | 14.8 (10.5-19.8) | 91 | 41.9 (35.7-48.8) | 40 | 18.4 (13.8-24.1) | 86 | 39.2 (33.0-45.8) | 29 | 13.3 (9.2-18.2) |
| 9-18 y | 121 | 35.6 (30.7-40.9) | 29 | 8.5 (5.9-11.9) | 141 | 41.6 (36.5-47.0) | 49 | 14.6 (11.1-18.5) | 119 | 35.2 (30.2-40.3) | 25 | 7.4 (4.9-10.5) |
| 19-24 y | 130 | 44.2 (38.6-49.9) | 34 | 11.6 (8.3-15.6) | 129 | 43.9 (38.3-49.6) | 34 | 11.6 (8.3-15.6) | 130 | 44.2 (38.6-49.9) | 34 | 11.6 (8.3-15.6) |
| Female participants | 214 | 28.4 (25.3-31.7)a | 70 | 9.4 (7.4-11.5)b | 214 | 28.5 (25.3-31.7) | 71 | 9.5 (7.5-11.7) | 177 | 23.4 (20.6-26.6)e | 49 | 6.6 (4.9-8.4)f |
| 3-8 y | 86 | 41.7 (35.0-48.3)g | 37 | 17.8 (13.1-23.5)g | 78 | 37.7 (31.4-44.6)g | 27 | 13.3 (9.0-18.2) | 59 | 28.5 (22.7-34.9) | 17 | 8.3 (5.0-12.5) |
| 9-18 y | 72 | 22.8 (18.4-27.6) | 17 | 5.3 (3.3-8.3) | 82 | 25.8 (21.3-30.9) | 27 | 8.5 (5.8-12.0) | 63 | 19.7 (15.8-24.5) | 15 | 4.8 (2.8-7.5) |
| 19-24 y | 55 | 24.0 (18.7-29.7) | 17 | 7.4 (4.5-11.3) | 55 | 24.0 (18.7-29.7) | 17 | 7.4 (4.5-11.3) | 55 | 24.0 (18.7-29.7) | 17 | 7.4 (4.5-11.3) |
95%CI, 95% confidence interval; IOTF, International Obesity Task
 and obesity according to IOTF, WHO, and Orbegozo 2011 criteria by age brackets. 95%CI, 95% confidence interval; EW, excess weight (overweight + obesity); IOTF, International Obesity Task Force; OB, obesity; WHO, World Health Organization.")
Prevalence of excess weight (overweight+obesity) and obesity according to IOTF, WHO, and Orbegozo 2011 criteria by age brackets. 95%CI, 95% confidence interval; EW, excess weight (overweight + obesity); IOTF, International Obesity Task Force; OB, obesity; WHO, World Health Organization.
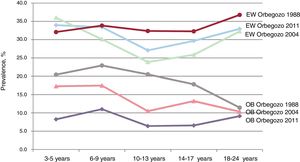
The reference tables prepared by the Orbegozo Foundation have been modified over time, with standards published in 1988, 2004, and 2011. Considering the different criteria (figure 2), the estimated prevalence of overweight varied between 30.3% (95%CI, 27.9-32.7) in 2004 and 34.4% (95%CI, 31.7-36.3) in 1988. The estimated prevalence of obesity varied between 8.6% (95%CI, 6.6-9.3) in 2011 and 16.7% (95%CI, 14.5-18.5) in 1988. The greatest differences between criteria were observed in the age bracket of 9 to 18 years. For obesity, the highest estimated rate was observed in the age bracket of 3 to 8 years (1988 criteria) and the lowest estimated rate was observed in the age bracket of 9 to 18 years (2011 criteria). Applying the criteria of the IOTF, the WHO, and Orbegozo 2011, 8% (95%CI, 6.8-9.2) were classified as obese and 29.6% (95%CI, 26.9-31.4%) were classified as overweight.
 and obesity according to the Orbegozo Foundation criteria of 1988, 2004, and 2011 by age brackets. EW, excess weight (overweight+obesity); OB, obesity.")
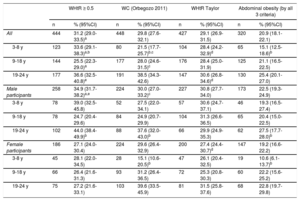
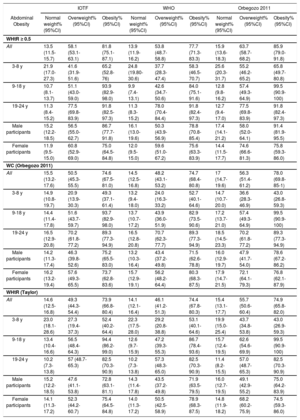
The estimated prevalence of AO was 29.8% (95%CI, 27.6-32.1) (Orbegozo 2011 criteria), which was similar to that estimated using the Taylor criteria. According to a WHtR equal to or more than 0.5, the estimated prevalence of AO was 31.2% (95%CI, 29.0-33.5). The prevalence of AO was higher in males and increased with age (table 4). Using the 3 criteria, the estimated prevalence of AO was 20.9% (95%CI, 18.1-22.1). table 5 shows the prevalence of AO according to different criteria by weight classification (IOTF, WHO, and Orbegozo 2011 criteria). The estimated prevalence of AO among participants classified as obese was 81.8% (95%CI, 75.1-87.1) (WHtR ≥ 0.5): however, the percentages were somewhat lower with the other criteria. More than 77% of those classified as obese were also characterized as having AO according to each of the 3 criteria, and 71.6% (95%CI, 64.1-79.3) of cases were classified as having AO according to the 3 criteria.
Prevalence of abdominal obesity by age groups and sex according to different criteria
| WHtR ≥ 0.5 | WC (Orbegozo 2011) | WHtR Taylor | Abdominal obesity (by all 3 criteria) | |||||
|---|---|---|---|---|---|---|---|---|
| n | % (95%CI) | n | % (95%CI) | n | % (95%CI) | n | % (95%CI) | |
| All | 444 | 31.2 (29.0-33.5)a | 448 | 29.8 (27.6-32.1) | 427 | 29.1 (26.9-31.5) | 320 | 20.9 (18.1-22.1) |
| 3-8 y | 123 | 33.6 (29.1-38.3)a,b | 80 | 21.5 (17.7-25.7)b,c | 104 | 28.4 (24.2-32.9)d | 65 | 15.1 (12.5-18.6)b |
| 9-18 y | 144 | 25.5 (22.3-29.0)a | 177 | 28.0 (24.6-31.5)c | 176 | 28.4 (25.0-31.9) | 125 | 21.1 (16.5-22.5) |
| 19-24 y | 177 | 36.6 (32.5-40.8)e | 191 | 38.5 (34.3-42.6) | 147 | 30.6 (26.8-34.6)d | 130 | 25.4 (20.1-27.0) |
| Male participants | 258 | 34.9 (31.7-38.2)a,e | 224 | 30.0 (27.0-33.2)c | 227 | 30.8 (27.7-34.0) | 173 | 22.5 (19.3-24.9) |
| 3-8 y | 78 | 39.0 (32.5-45.8) | 52 | 27.5 (22.0-34.1) | 57 | 30.6 (24.7-37.1) | 46 | 19.3 (16.5-27.4) |
| 9-18 y | 78 | 24.7 (20.4-29.6) | 84 | 24.9 (20.7-29.9) | 104 | 31.3 (26.6-36.5) | 65 | 20.4 (15.0-22.5) |
| 19-24 y | 102 | 44.0 (38.4-49.9)b | 88 | 37.6 (32.0-43.0)b | 66 | 29.9 (24.9-35.3) | 62 | 27.5 (17.7-28.0)b |
| Female participants | 186 | 27.1 (24.0-30.4) | 224 | 29.6 (26.4-32.9) | 200 | 27.4 (24.4-30.7)d | 147 | 19.2 (16.6-22.2) |
| 3-8 y | 45 | 28.1 (22.0-34.5) | 28 | 15.1 (10.6-20.5)b | 47 | 26.1 (20.4-32.5) | 19 | 10.6 (6.1-13.7)b |
| 9-18 y | 66 | 26.4 (21.6-31.3) | 93 | 31.2 (26.4-36.5) | 72 | 25.3 (20.8-30.3) | 60 | 22.2 (15.6-25.2) |
| 19-24 y | 75 | 27.2 (21.6-33.1) | 103 | 39.6 (33.5-45.9) | 81 | 31.5 (25.8-37.6) | 68 | 22.8 (19.7-29.8) |
95%CI, 95% confidence interval; WC, waist circumference; WHtR, waist-to-height ratio.
Prevalence of abdominal obesity defined according to distinct criteria by weight classification categories defined according to the IOTF, WHO, and Orbegozo 2011 criteria
| IOTF | WHO | Orbegozo 2011 | |||||||
|---|---|---|---|---|---|---|---|---|---|
| Abdominal Obesity | Normal weight% (95%CI) | Overweight% (95%CI) | Obesity% (95%CI) | Normal weight% (95%CI) | Overweight% (95%CI) | Obesity% (95%CI) | Normal weight% (95%CI) | Overweight% (95%CI) | Obesity% (95%CI) |
| WHtR ≥ 0.5 | |||||||||
| All | 13.5 (11.5-15.7) | 58.1 (53.1-63.1) | 81.8 (75.1-87.1) | 13.9 (11.9-16.2) | 53.8 (48.7-58.8) | 77.7 (71.3-83.3) | 15.9 (13.6-18.3) | 63.7 (58.7-68.2) | 85.9 (79.0-91.8) |
| 3-8 y | 21.9 (17.0-27.3) | 41.6 (31.9-51.6) | 65.2 (52.8-76) | 24.8 (19.80-30.6) | 37.7 (28.3-47.4) | 58.3 (46.5-70.7) | 25.6 (20.3-31.7) | 55.2 (46.2-65.2) | 65.8 (49.7-80.8) |
| 9-18 y | 10.7 (8.1-13.7) | 51.1 (43.0-59.0) | 93.9 (82.9-98.0) | 9.9 (7.4-13.1) | 42.6 (34.7-50.6) | 84.0 (75.1-91.6) | 12.8 (9.8-16.2) | 57.4 (49.3-64.9) | 99.5 (90.9-100) |
| 19-24 y | 11.3 (8.4-15.2) | 77.5 (69.8-83.9) | 91.8 (82.5-97.3) | 11.3 (8.3-15.2) | 78.0 (70.4-84.4) | 91.8 (82.4- 97.3) | 12.7 (9.4-17.0) | 77.5 (69.8-83.9) | 91.8 (82.4-97.3) |
| Male participants | 15.2 (12.2-18.5) | 56.5 (55.0-62.7) | 86.7 (77.7-91.8) | 16.1 (13.0-19.6) | 50.3 (43.9-56.9) | 78.8 (70.8-85.4) | 17.4 (14.1-21.2) | 58.0 (52.0-64.1) | 91.4 (81.9-95.5) |
| Female participants | 11.9 (9.5-15.0) | 60.8 (52.9-69.0) | 75.0 (64.5-84.8) | 12.0 (9.5-15.0) | 59.6 (51.0-67.2) | 75.6 (63.3-83.9) | 14.4 (11.5-17.7) | 74.6 (66.6-81.3) | 75.8 (59.3-86.0) |
| WC (Orbegozo 2011) | |||||||||
| All | 15.5 (13.2-17.6) | 50.5 (45.3-55.5) | 74.6 (67.5-81.0) | 14.5 (12.5-16.8) | 48.2 (43.1-53.2) | 74.7 (68.4-80.8) | 17 (14.7-19.6) | 56.3 (51.4-61.2) | 78.0 (69.8-85-1) |
| 3-8 y | 14.9 (10.8-19.7) | 20.9 (13.9-30.3) | 49.3 (37.1-61.4) | 13.2 (9.4-18.0) | 24.0 (16.3-33.2) | 52.7 (40.1-64.6) | 14.7 (10.7-20.0) | 36.6 (28.3-46.9) | 43.0 (26.8-59.3) |
| 9-18 y | 14.4 (11.4-17.8) | 51.6 (43.7-59.7) | 93.7 (82.9-98.0) | 13.7 (10.7-17.2) | 43.9 (36.0-51.9) | 82.9 (73.5-90.6) | 17.2 (13.7-21.0) | 57.4 (49.3-64.9) | 99.5 (90.9-100) |
| 19-24 y | 16.5 (12.9-20.8) | 70.2 (61.8-77.2) | 89.3 (77.3-94.9) | 16.5 (12.8-20.8) | 70.7 (62.3-77.7) | 89.3 (77.3-94.9) | 18.5 (14.5-23.3) | 70.2 (61.8-77.2) | 89.3 (77.3-94.9) |
| Male participants | 14.2 (11.3-17.4) | 46.3 (39.8-52.6) | 75.2 (65.5-83.0) | 13.2 (10.3-16.4) | 43.4 (37.2-49.8) | 71.5 (62.6-78.8) | 16.0 (12.9-19.7) | 47.9 (41.7-54.0) | 78.6 (67.2-86.2) |
| Female participants | 16.2 (13.2-19.4) | 57.6 (49.3-65.5) | 73.7 (62.8-83.6) | 15.7 (12.9-19.1) | 56.2 (48.2-64.4) | 80.3 (68.3-87.5) | 17.9 (14.7-21.5) | 72.1 (64.1-79.3) | 76.8 (62.1-87.9) |
| WHtR (Taylor) | |||||||||
| All | 14.6 (12.5-16.8) | 49.3 (44.3-54.4) | 73.9 (66.8-80.4) | 14.1 (12.1-16.4) | 46.1 (41.2-51.3) | 74.4 (67.8-80.3) | 15.4 (13.1-17.7) | 55.7 (50.6-60.4) | 74.9 (65.8-82.0) |
| 3-8 y | 23.0 (18.1-28.6) | 27.3 (19.4-37.3) | 52.4 (40.2-64.4) | 22.3 (17.5-28.0) | 29.2 (20.8-38.8) | 53.1 (40.1-64.6) | 19.9 (15.0-25.4) | 43.7 (34.8-53.8) | 43.0 (26.9-59.3) |
| 9-18 y | 13.4 (10.4-16.6) | 56.5 (48.4-64.3) | 94.4 (86.2-99.0) | 12.6 (9.7-15.9) | 47.2 (39.3-55.3) | 86.7 (78.4-93.6) | 15.7 (12.4-19.5) | 62.6 (54.6-69.9) | 99.5 (90.9-100) |
| 19-24 y | 10.2 (7.3-13.8) | 57 (48.7-65.3) | 82.5 (70.3-90.9) | 10.2 (7.3-13.8) | 57.3 (48.3-65.0) | 82.5 (70.3-90.9) | 11.4 (8.2-15.5) | 57.0 (48.7-65.3) | 82.5 (70.3-90.9) |
| Male participants | 15.2 (12.2-18.5) | 47.6 (41.1-53.8) | 72.8 (63.1-81.1) | 14.3 (11.4-17.8) | 43.5 (37.2-49.8) | 71.9 (63.5-79.5) | 16.0 (12.7-19.5) | 49.1 (42.9-55.2) | 75.0 (64.2-83.9) |
| Female participants | 14.1 (11.3-17.2) | 52.3 (44.2-60.7) | 75.4 (64.5-84.8) | 14.0 (11.3-17.2) | 50.5 (42.5-58.9) | 78.9 (68.3-87.5) | 14.8 (11.9-18.2) | 68.2 (60.2-75.9) | 74.5 (59.3-86.0) |
95%CI, 95% confidence interval; IOTF, International Obesity Task Force; WC, waist circumference; WHO, World Health Organization WHtR, waist-to-height ratio.
The overweight category is limited to individuals with body mass index values higher than those that define normal weight but lower than those that define obesity.
Participants were classified as having AO with distinct criteria and were also classified as obese by the 3 criteria: 5.7% (95%CI, 4.2-6.4) of the total of which 7% (95%CI, 5.4-8.6) were male and 4.3% (95%CI, 2.9-5.9) were female. This study suggests that an estimated 16% (95%CI, 13.8-17.8) of the Spanish population between 3 and 24 years have excess weight and concomitant AO: male participants, 18.1% (95%CI, 15.7-20.4), and female participants, 13.7% (95%CI, 11.3-16.1).
DISCUSSIONThe ENPE cross-sectional study found that the estimated prevalence of excess weight in the population younger than 25 years was 34% (95%CI, 31.8-36.4) (IOTF). The prevalence was higher in male participants (39.2%; IC95%, 36.1-42.6) than in female participants (28.4%; 95%CI, 25.3-31.7), and affected around 40% of the population in the age bracket of 3 to 8 years.
When different criteria were used, the estimated prevalence of AO in this age bracket was close to 30%, was higher in men, and affected up to 70% of those classified as being obese.
Little information is available on this age bracket in Spain and other countries. In the United States, the prevalence of obesity in preschoolers was 13.9%28. The Toy Box project was a pan-European study that estimated overweight and obesity in children aged between 3 and 5 years. The Spanish sample was recruited in the province of Zaragoza. Higher rates were found in southern Europe, especially in Greece.29 The IDEFICS study obtained similar results in the age bracket of 2 to 9 years.7 Other relevant studies on the situation in Spain include the ELOIN study conducted in the Community of Madrid,8 those conducted in some autonomous communities,9,30 and other local studies.31
In the 1980s, the PAIDOS study provided the first results based on individual anthropometric measurements (obesity criterion: triceps skinfold >2 standard deviations).32 At the beginning of the 21st century, the enKid study investigated the magnitude of the problem and a set of determining factors.23 That study23 applied the IOTF criteria and found that the estimated prevalence of excess weight and obesity in the age bracket of 2 to 24 years was 24.5% and 6.2%, respectively. Today, 15 years later, the estimated prevalence of excess weight (overweight+obesity) and obesity is 30.1% and 10.3%, respectively.
Several studies have used distinct Orbegozo criteria to estimate prevalence, and thus they have obtained different results. These studies have also shown that BMI has increased in the reference populations in recent decades.
The ALADINO study (2011-2015) was conducted by the Spanish Agency for Food Safety and Nutrition (AESAN)33 within the framework of the COSI initiative in Europe.5 The study found that in 2011, the estimated prevalence of overweight (IOTF criteria) in schoolchildren (6-9 years) was 24.2% and obesity was 11% in boys and 11.2% in girls. These figures are similar to those estimated by the PERSEO project in 2007-2008 (schoolchildren, 6-10 years) in 6 autonomous communities, Ceuta, and Melilla.34 The ALADINO 201535 study used the same criteria in the same age bracket, and found an estimated prevalence of overweight and obesity of 21.8% and 11.2%, respectively. In 2012, Sánchez-Cruz et al.6 found an estimated prevalence of overweight of 22.3% and obesity of 8.6% in the population aged 8 to17 years (IOTF criteria). Recent studies36 have used data collected by successive health surveys (declared weight and height) to analyze the prevalence of excess weight in children younger than 15 years in Spain and its trends over the period 1983 to 2011. However, given the inaccuracy and bias of estimates of the prevalence of overweight and obesity based on data reported in children and adolescents,37 expert committees have recommended establishing surveillance systems based on individual anthropometric measurements.5,13
In Portugal, the estimated prevalence of overweight (IOTF criteria) in schoolchildren (6-10 years) was 21.9% and that of obesity was 6.1%. These percentages are lower than those observed in the same age bracket by the ENPE study.38 In contrast, the estimated prevalence in Greek schoolchildren and adolescents39 was higher than that estimated in the ENPE study.
Although there is some evidence of an association between anthropometric indicators and cardiometabolic risk in preschoolers, information is scarce and not always in agreement. A significant association was found in children (2-5 years) between BMI, WC, triceps and subscapular skinfolds, and body fat percentage with fasting insulin and HOMAIR.40 There is even less information on the composition of the microbiome and the metabolic activity profile at these ages. Excess weight at an early age is associated with an increased risk of adult obesity, especially if it persists until adolescence,1,41 and if obesogenic family and social environments favor this trend. It has been suggested that the risk of adult obesity is better predicted by the rate of change of BMI during puberty and afterward, rather than the absolute value of the BMI.41 Other authors have also highlighted the relevance of the rate of change of BMI in the preschool stage as a target of pediatric care and preventive interventions.1
Studies have analyzed the validity and accuracy of WC as an indicator of AO in infants and children due to the correlation between WC and body fat percentage42. Other studies have recommended the use of distinct cutoff points by age and sex27. In 2012, Cole and Lobstein21 published extended IOTF BMI cutoffs that were derived using the LMS method. It has been proposed that the use of the WHtR provides better estimates of adiposity after adjusting for size.26 Several studies have compared the specificity and predictive value of these indicators of cardiometabolic risk in children and adolescents.12,42
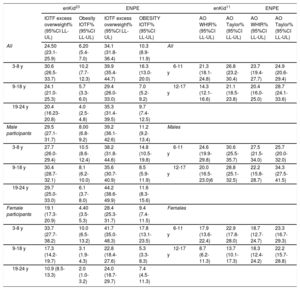
In Spain, few studies have reported the estimated prevalence of AO in children and adolescents. Schröder et al.11 used data from the enKid study23 (age bracket 6-17 years), and found an estimated prevalence of 21.3% (WHtR) and 26.8% (Taylor criteria): the percentages were higher in those in the age bracket of 6 to 11 years and were also higher in male participants (table 6). Data from the ENPE study suggest that there has been an increase in the prevalence of AO of at least 5 percentage points in boys and girls in the 2 age brackets referred to in the enKid study.23 Prevalence was even higher according to Taylor criteria. In Portuguese schoolchildren (6-10 years), the estimated prevalence of AO (WHtR) was 21.9%,38 which was lower than the estimated prevalence (23.7%) in the same age bracket in the ENPE study. In Greece, the estimated prevalence of AO (WHtR) in schoolchildren and adolescents was slightly higher.39 In the United States, the estimated prevalence of AO (WHtR) in the age bracket of 2 to 18 years was 33.3%.43
| enKid23 | ENPE | enKid11 | ENPE | ||||||
|---|---|---|---|---|---|---|---|---|---|
| IOTF excess overweight% (95%CI LL-UL) | Obesity IOTF% (95%CI LL-UL) | IOTF excess overweight% (95%CI LL-UL) | OBESITY IOTF% (95%CI LL-UL) | AO WHtR% (95%CI LL-UL) | AO Taylor% (95%CI LL-UL) | AO WHtR% (95%CI LL-UL) | AO Taylor% (95%CI LL-UL) | ||
| All | 24.50 (23.1-25.9) | 6.20 (5.4-7.0) | 34.1 (31.8-36.4) | 10.3 (8.9-11.9) | All | ||||
| 3-8 y | 30.6 (26.5-33.7) | 10.2 (7.7-12.3) | 39.9 (35.4-44.7) | 16.3 (13.0-20.0) | 6-11 y | 21.3 (18.1-24.8) | 26.8 (23.2-30.4) | 23.7 (19.4-27.7) | 24.9 (20.6-29.4) |
| 9-18 y | 24.1 (21.0-25.3) | 5.7 (3.3-6.0) | 29.4 (26.0-33.0) | 7.0 (5.2-9.2) | 12-17 y | 14.3 (12.1-16.6) | 21.1 (18.5-23.8) | 20.4 (16.0-25.0) | 28.7 (24.1-33.6) |
| 19-24 y | 20.4 (16.23-20.8) | 4.0 (2.5-4.8) | 35.3 (31.4-39.5) | 9.7 (7.4-12.5) | |||||
| Male participants | 29.5 (27.1-31.7) | 8.00 (6.8-9.2) | 39.2 (36.1-42.6) | 11.2 (9.2-13.4) | Males | ||||
| 3-8 y | 27.7 (26.0-29.4) | 10.5 (8.6-12.4) | 38.2 (31.8-44.6) | 14.8 (10.5-19.8) | 6-11 y | 24.6 (19.9-29.8) | 30.6 (25.5-35.7) | 27.5 (21.5-34.0) | 25.7 (20.0-32.0) |
| 9-18 y | 30.4 (28.7-32.1) | 8.1 (6.2-10.0) | 35.6 (30.7-40.9) | 8.5 (5.9-11.9) | 12-17 y | 20.0 (16.5-23.0)6 | 28.8 (25.1-32.5) | 22.2 (15.8-28.7) | 34.3 (27.5-41.5) |
| 19-24 y | 29.7 (25.0-33.0) | 6.1 (3.7-8.0) | 44.2 (38.6-49.9) | 11.6 (8.3-15.6) | |||||
| Female participants | 19.1 (17.3-20.9) | 4.40 (3.5-5.3) | 28.4 (25.3-31.7) | 9.4 (7.4-11.5) | Females | ||||
| 3-8 y | 33.7 (27.7-38.2) | 10.0 (6.5-13.2) | 41.7 (35.0-48.3) | 17.8 (13.1-23.5) | 6-11 y | 17.9 (13.6-22.4) | 22.9 (17.8-28.0) | 18.7 (12.7-24.7) | 23.3 (16.7-29.3) |
| 9-18 y | 17.3 (14.2-19.7) | 3.1 (1.9-4.3) | 22.8 (18.4-27.6) | 5.3 (3.3-8.3) | 12-17 y | 8.7 (6.2-11.3) | 13.7 (10.1-17.3) | 18.3 (12.4-24.2) | 22.2 (15.7-28.8) |
| 19-24 y | 10.9 (8.5-13.3) | 2.0 (1.0-3.2) | 24.0 (18.7-29.7) | 7.4 (4.5-11.3) | |||||
95%CI, 95% confidence interval; AO, abdominal obesity; IOTF, International Obesity Task Force; LL-UL, lower limit to upper limit; WC, waist circumference; WHtR, waist-to-height ratio.
The ENPE study has some limitations. Among these, the protocol did not include biochemical or clinical indicators of cardiometabolic risk. This aspect remains a matter of debate. Research ethics committees often reject their use in healthy children and young people. The study also has several strengths. It provides updated information on the prevalence of overweight, obesity, and AO in a randomized Spanish sample in the age bracket of 3 to 24 years. This information was based on anthropometric measurements taken in participants’ homes by trained observers following standardized international protocols. Estimated prevalences are presented according to various criteria, allowing comparisons with other local, regional, and international studies. It also assesses trends in the prevalence of excess weight and AO.
Measures to prevent and manage obesity have been addressed by various international health and educational institutions as well as Spanish central and regional administrations. For example, scientific societies, such as the Spanish Society for the Study of Obesity,44 have made recommendations on this topic. The Spanish Society of Cardiology and the Spanish Heart Foundation have prepared a report that includes a detailed analysis of the situation in Spain and specific proposals for action in the near future.45
CONCLUSIONSThe prevalence of overweight, obesity, and AO in the Spanish population aged 3 to 24 years is high and is higher in male participants than in female participants. The estimated prevalence of AO was 30% with distinct criteria. In total, 20.9% (95%CI, 18.1-22.1) were classified as having AO with the 3 criteria and the estimated prevalence of excess weight and concomitant AO was 16% (95%CI, 13.8-17.8). Of those classified as obese with the 3 criteria, 71.6% were also classified as having AO with the 3 different cutoff points. Excess weight continues to increase in the Spanish population younger than 25 years, thus it seems necessary to improve surveillance systems and preventive strategies.
FUNDINGThe ENPE study was funded by the Eroski Foundation through an agreement with SPRIM and the Spanish Society of Community Nutrition (SENC). The sponsor did not contribute to the study design, data collection, analysis or interpretation of the results, drafting the manuscript, or to the decision to publish the results.
CONFLICTS OF INTERESTNone declared.
- –
Obesity in children and adolescents is a major problem due to its magnitude and growth rate. It has adverse health effects during these life stages and affects the quality of life in adults. The prevalence of childhood and adolescent obesity in Spain is among the highest in Europe.
- –
This study provides recent data on the prevalence of excess eight and AO in the Spanish population aged 3 to 24 years based on individual anthropometric measurements. Various criteria were used to define obesity and AO. The study provides estimates that are comparable to those of other studies conducted in Spain and other countries.
The authors would like to acknowledge the technical and logistic support of the SIGMA DOS company, technical support provided by SPRIM-Spain, sponsorship by the Eroski Foundation and, in particular, the work conducted by the health interviewers with specific face-to-face training. We would also like to acknowledge the generosity of all the people who agreed to participate in the study.
Supplementary data associated with this article can be found in the online version available at https://doi.org/10.1016/j.recesp.2019.07.011