To describe, for the first time, reference values for the cardio-ankle vascular index (CAVI), brachial-ankle pulse wave velocity (BA-PWV), carotid-femoral pulse wave velocity (CF-PWV), and the central augmentation index and to establish their association with cardiovascular risk factors in the Spanish adult population aged 35 to 75 years without cardiovascular disease.
MethodsWe conducted a cross-sectional study. Through random sampling stratified by age and sex, we included 501 participants without cardiovascular disease. The mean age was 55.9 years and 50.3% were women. The measurements were taken using the SphigmoCor and Vasera VS-1500 devices.
ResultsValues for all measures, except those for the central augmentation index, were higher in men and increased with age and blood pressure. The mean values were as follows: CAVI, 8.01±1.44; BA-PWV, 12.93±2.68m/s; CF-PWV, 6.53±2.03 m/s, and central augmentation index, 26.84±12.79. On multiple regression analysis, mean blood pressure was associated with the 4 measures, glycated hemoglobin was associated with all measures except the central augmentation index, and body mass index showed an inverse association with CAVI. The explanatory capacity of age, sex, and mean blood pressure was 62% for BA-PWV, 49% for CF-PWV 49%, 54% for the CAVI, and 38% for the central augmentation index. On logistic regression, hypertension was associated with the CAVI (OR=3.45), VOP-BT (OR=3.44), VOP-CF (OR=3.38) and with the central augmentation index (OR=3.73).
ConclusionsAll arterial stiffness measures increased with age. The CAVI and CF-PWV were higher in men and the central augmentation index was higher in women, with no differences in BA-PWV.
This study is registered at ClinicalTrials.gov. Identifier NCT02623894.
Keywords
Arterial stiffness is principally determined by age, sex, and blood pressure1 and is associated with cardiovascular risk factors (CVRFs).2 Meta-analyses of numerous studies have established an association between arterial stiffness and an increase in cardiovascular events.3,4 Increased arterial stiffness precedes changes in vessel structure, and its early detection therefore has an important role to play in disease prevention.5
Arterial stiffness can be assessed noninvasively from several parameters. The gold standard measure is carotid-femoral pulse wave velocity (CF-PWV), which is determined by tonometry.2 CF-PWV is dependent on blood pressure at the time of measurement and reflects arterial stiffness in the descending aorta, the iliac arteries, the first segment of the femorals, the brachiocephalic trunk, and the common carotid artery but does not evaluate the ascending aorta.6 Brachial-ankle pulse wave velocity (BA-PWV) is measured by oscilometry and estimates peripheral arterial stiffness in the tibial and brachial arteries.7
Another oscilometry-based measure is the cardio-ankle vascular index (CAVI), which analyzes arterial stiffness in the aorta (including the ascending aorta) and the iliac, femoral, and tibial arteries; CAVI is independent of blood pressure at the time of measurement.8 Lastly, the central augmentation index (cAI) tracks the increase in central blood pressure caused by wave reflections returning from the peripheral arteries; cAI is the most widely used surrogate of arterial wave reflections, and some authors regard it as a measure of systemic arterial stiffness.9
Several studies in recent years have reported mean values for these parameters stratified by age and sex. For example, CF-PWV has been assessed in a European population6 and a Spanish population older than 65 years,10 BA-PWV has been assessed in an Asian population,11 CAVI has been assessed in populations from Japan12 and the Mediterranean region,13 and cAI has been explored in a Korean population.14 Other studies have assessed the association between arterial stiffness and CVRFs. However, no previous study has addressed these 2 questions in a single population without cardiovascular disease.
The current study examined arterial stiffness in a population of Spanish adults between the ages of 35 and 75 years and with no overt cardiovascular disease. The study had 3 objectives: a) to provide the first definition of reference values for CAVI, BA-PWV, CF-PWV, and cAI in this population; b) to study the relationship between arterial stiffness measures and CVRFs; and c) to analyze sex differences.
METHODSStudy designWe conducted a cross-sectional descriptive study of participants in the EVA study (Association between different risk fact ors and vascular accelerated ageing study) (NCT02623894).17
Study populationParticipants were recruited from an urban population of 43 946 individuals assigned to 5 health care centers. A total of 501 participants between the ages of 35 and 75 years was selected by a random sampling stratified by age group (35-44, 45-54, 55-54, 65-74, and >75 years) and sex, with approximately 100 participants (50 men and 50 women) in each age group. The study population was selected between June 2016 and November 2017. The inclusion criteria were age between 35 and 75 years and provision of written informed consent. The exclusion criteria were end-stage disease; inability to attend the assigned health care centers; a history of cardiovascular disease; a glomerular filtration rate <30mL/min/1.73 m2; chronic inflammatory disease or an acute inflammatory process in the preceding 3 months; or treatment with estrogens, testosterone, or growth hormone.
Accepting an alpha risk of 0.05, the 501-participant sample size allowed us to estimate the arterial stiffness parameters with the following levels of precision: CAVI,±0.125 units (standard deviation±1.44); BA-PWV,±0.235 m/s (standard deviation±2.68 m/s); CF-PWV,±0.175 m/s (standard deviation±2.03 m/s); and cAI,±1.125% (standard deviation±12.70%).
Variables and measurement devicesThe variables collected and tests performed are described in detail in the EVA study protocol.17 Prior training was provided to nursing staff performing the tests and conducting the questionnaires. The measurement of CVRFs is described in detail in the Appendix of the supplementary data.
Arterial stiffness parametersCentral augmentation index and carotid-femoral pulse wave velocityThese parameters were measured with a SphygmoCor device (AtCorMedical Pty Ltd; West Ryde, Australia). For the measurement of CF-PWV, patients were seated with their dominant arm supported on a rigid surface. Central and peripheral blood pressure readings were obtained with a sensor located over the radial artery, and pulse wave morphology in the aorta and cAI were estimated with the following formula: central blood pressure increase×100 / pulse pressure, adjusted to a 75 bpm heart rate. For the analysis of carotid and femoral pulse waves, patients were placed in a supine position, the delay relative to the electrocardiogram wave was estimated, and PWV was calculated. Distances were measured with a measuring tape from the sternal notch to the positions of the sensors over the carotid and femoral arteries and were multiplied by 0.8.18
Cardio-ankle vascular index and brachial-ankle pulse wave velocityCAVI and BA-PWV were measured with a VaSera VS-1500 vascular screening system (FukudaDenshi) according to the manufacturer's instructions.19 Participants were asked not to smoke or consume caffeine for 1 hour before the examination and to lie down for at least 10minutes before the measurement. Cuffs were fitted to the size of the arms and ankles. Electrodes were attached to the 2 arms and ankles, and a microphone was fixed with double-sided tape over the sternum in the second intercostal space. CAVI measurements were considered valid only when obtained during at least 3 consecutive heartbeats.8 CAVI was calculated with the following equation:

where PWV is the value measured from the aortic valve orifice to the ankle; Ps and Pd are the systolic and diastolic blood pressure; ΔP is the change in blood pressure; and ρ is the blood density.8
BA-PWV was calculated with the following equation:

where TBA is the time interval between the brachial and ankle pulse waves.8
For all the parameters analyzed, a higher value indicates greater arterial stiffness.
Statistical analysisContinuous variables are expressed as mean±standard deviation, and for the arterial stiffness parameters we calculated the 5th, 10th, 25th, 50th, 75th, 90th, and 95th percentiles. Categorical variables are presented as number and percentage. Comparisons of means between 2 independent categories were made by the Student t test, and proportions were compared by the chi-square test. Comparisons of means between more than 2 groups were made by the ANOVA and ANCOVA tests, using the Bonferroni correction for posthoc comparisons.
Associations among arterial stiffness parameters and other variables were studied with a set of 3 multiple regression analyses. a) One analysis used 4 models to calculate the per-decade increase in arterial stiffness. The dependent variables were CAVI, BA-PWV, CF-PWV, and cAI; the independent variable was the age decade; and the adjustment variables were mean blood pressure, glycohemoglobin, body mass index, atherogenic index, and the numer of smoking years. b) Another analysis examined the association between CAVI, BA-PWV, CF-PWV, and cAI. Explicit variables were mean blood pressure, glycohemoglobin, body mass index, atherogenic index, and the number of smoking years, and the adjustment variables were age and pharmacotherapy with hypotensive, hypoglycemic, and hypolipidemic drugs. c) For each arterial stiffness parameter, a set of 7 equations was derived by successively incorporating the following variables: age, sex, mean blood pressure, smoking, diabetes mellitus, dyslipidemia, and obesity.
A set of 4 logistic regression models was developed using CAVI, BA-PWV, CF-PWV, and cAI as response variables. The independent variables were hypertension, diabetes mellitus, obesity, and dyslipidemia. The adjustment variables were age; pharmacotherapy with hypotensive, hypoglycemic, and hypolipidemic drugs; and the analyzed CVRFs. Cut-off values for defining arterial stiffness as pathological were the values closest to the 75th percentile in each variable (CAVI ≥ 9; BA-PWV ≥ 14.50 m/s, CF-PWV ≥ 7.5 m/s, and cAI ≥ 35). For CVRFs, 1=presence and 0=absence.
All analyses were conducted with the statistical package SPSS for Windows, version 23.0 (IBM Corp; Armonk, New York, United States). The limit of statistical significance in the hypothesis comparison was established at an α risk=0.05.
Ethics statementAll participants were informed about the study and gave written informed consent before inclusion. The study was approved on May 4, 2015 by the Salamanca health area ethics committee. The study was conducted in accordance with the recommendations of the Helsinki declaration.20
RESULTSStudy populationThe study flow chart shows the reference population (43 946), the included participants and the excluded population, and the reasons for exclusion by age group and sex (Figure 1 in the supplementary data). The study included 501 individuals, with a mean age of 55.90±14.24 years; 50.3% were women.
Clinical variables in the total study population and by sex are shown in Table 1. Values for blood pressure, glycemia, triglycerides, body mass index, and waist circumference were higher in men, whereas high-density lipoprotein values were lower. Men also had a higher prevalence of hypertension and diabetes mellitus than women. Mean values of arterial stiffness parameters were as follows: CAVI, 8.01±1.44; BA-PWV, 12.93±2.68 m/s; CF-PWV, 6.53±2.03 m/s; and cAI, 26.84±12.79. CAVI and CF-PWV were higher in men, whereas cAI was higher in women.
General characteristics of 35-75-year-old study participants in the total sample and by sex
| Variables | Total (N=501) | Men (n=249) | Women (n=252) | P |
|---|---|---|---|---|
| Age, y | 55.90±14.24 | 55.95±14.30 | 55.85±14.19 | .935 |
| Smokers | 90 (18.00) | 49 (19.70) | 41.00 (16.30) | .190 |
| Height, cm | 165.11±9.68 | 171.60±7.46 | 158.70±6.98 | <.001 |
| Weight, kg | 72.41±13.61 | 79.22±11.75 | 65.67±11.87 | <.001 |
| Waist circumference, cm | 93.33±12.01 | 98.76±9.65 | 87.93±11.70 | <.001 |
| BMI | 26.52±4.23 | 26.90±4.08 | 26.14±4.79 | .044 |
| BMI ≥ 30 | 94 (18.80) | 42 (16.90) | 52 (20.60) | .304 |
| SBP, mmHg | 120.69±23.13 | 126.47±19.52 | 114.99±24.96 | <.001 |
| DBP, mmHg | 75.53±10.10 | 77.40±9.37 | 73.67±10.46 | <.001 |
| MBP, mmHg | 87.44±13.21 | 93.76±11.13 | 80.58±12.61 | <.001 |
| Hypertension | 147 (29.34) | 82 (32.93) | 65 (25.79) | <.001 |
| Antihypertensive drugs | 96 (19.20) | 50 (20.10) | 46 (18.30) | .650 |
| Total cholesterol, mg/dL | 194.76±32.50 | 192.61±32.26 | 196.88±32.64 | .142 |
| LDL-C, mg/dL | 115.51±29.37 | 117.43±14.12 | 113.61±28.54 | .148 |
| HDL-C, mg/dL | 58.75±16.16 | 53.19±14.12 | 64.22±28.54 | <.001 |
| Triglycerides, mg/dL | 103.06±53.19 | 112.28±54.39 | 93.95±50.50 | <.001 |
| Atherogenic index | 3.54±1.07 | 3.84±1.15 | 3.24±0.93 | <.001 |
| Dyslipidemia | 191 (38.10) | 95 (38.10) | 96 (38.20) | .989 |
| Hypolipidemic drugs | 102 (20.40) | 49 (19.70) | 53 (21.00) | .396 |
| Glycemia, mg/dL | 88.21±17.37 | 90.14±18.71 | 86.30±15.73 | .013 |
| HbA1c, % | 5.49±0.56 | 5.54±0.63 | 5.44±0.47 | .044 |
| Diabetes mellitus | 38 (7.60) | 26 (10.50) | 12 (4.80) | .012 |
| Antidiabetic drugs | 35 (7.00) | 23 (9.20) | 12 (4.80) | .055 |
| GFR CKD-EPI, mL/min/1.73m2 | 93.17±16.38 | 91.54±16.42 | 94.77±16.21 | .027 |
| CAVI | 8.01±1.44 | 8.13±1.49 | 7.87±1.39 | .043 |
| CAVI ≥ 9 | 123 (24.60) | 79 (31.70) | 44 (17.50) | <.001 |
| BA-PWV, m/s | 12.93±2.68 | 13.16±2.46 | 12.71±2.86 | .064 |
| BA-PWV ≥ 14.5 m/s | 122 (24.60) | 67 (31.70) | 55 (17.50) | .116 |
| CF-PWV, m/s | 6.53±2.03 | 6.86±2.20 | 6.21±1.79 | <.001 |
| CF-PWV ≥ 7.5 m/s | 115 (23.30) | 72 (29.60) | 43 (17.20) | .001 |
| cAI | 26.84±12.79 | 22.09±13.57 | 31.54±9.97 | <.001 |
| cAI ≥ 35 | 119 (24.00) | 27 (30.10) | 92 (36.90) | <.001 |
BA-PWV, brachial-ankle pulse wave velocity; BMI, body mass index; cAI, central augmentation index; CAVI, cardio-ankle vascular index; CF-PWV, carotid-femoral pulse wave velocity; CKD-EPI, Chronic Kidney Disease Epidemiology Collaboration; DBP, diastolic blood pressure; GFR, glomerular filtration rate; HbA1c, glycohemoglobin; HDL-C, high-density lipoprotein cholesterol; LDL-C, low-density lipoprotein cholesterol; MBP, mean blood pressure; SBP, systolic blood pressure.
Continuous variables are expressed as mean±standard deviation and categorical variables as no. (%). P values refer to differences between men and women.
The characteristics of participants with invalid or missing arterial stiffness measures are shown in Table 1 of the supplementary data.
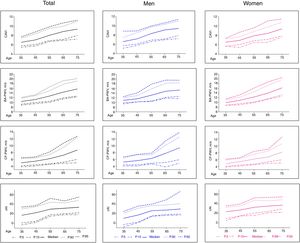
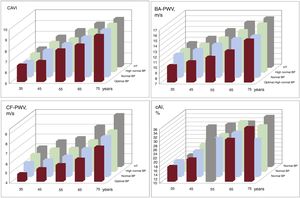
Reference values for the arterial stiffness parameters analyzedMedian values of arterial stiffness parameters stratified by age and sex are shown in Figure 1 and in Table 2 of the supplementary data, and the 5th, 10th, 25th, 50th, 75th, 90th, and 95th percentiles are shown in Table 3 of the supplementary data. Mean values by age group and blood pressure category are shown in Figure 2. All the arterial stiffness measures except for cAI increased with increasing blood pressure and age.

Age-stratified median values of arterial stiffness parameters and 5th, 10th, 90th, and 95th percentiles in the total study population and by sex. BA-PWV, brachial-ankle pulse wave velocity; cAI, central augmentation index; CAVI, cardio-ankle vascular index; CF-PWV, carotid-femoral pulse wave velocity.

Mean arterial stiffness parameter values by age decade and blood pressure category. BP categories, optimal, ≤ 120/80mmHg; normal,> 120/80mmHg and ≤ 130/85mmHg; high normal,> 130/85mmHg and ≤ 140/90mmHg; hypertension, ≥ 140/90mmHg. BA-PWV, brachial-ankle pulse wave velocity; BP, blood pressure; cAI, central augmentation index; CAVI, cardio-ankle vascular index; CF-PWV, carotid-femoral pulse wave velocity; HT, hypertension.
Correlations between the analyzed arterial stiffness parameters are shown in Table 4 of the supplementary data.
In the 65–74-year age band, CAVI was higher in men than in women (P=.001). Among study participants older than 75 years, BA-PWV was higher in women (P=.041). In all age bands, CF-PWV was higher in men and cAI was higher in women (P=.001) (Figure 2 of the supplementary data).
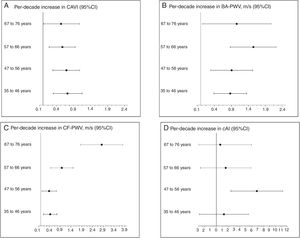
The overall CVRF-adjusted per-decade increases in arterial stiffness measures are shown in Figure 3, and the sex-stratified data are shown in Table 5 of the supplementary data.

Annual increase and 95%CI by age decade in the 4 arterial stiffness parameters measured, adjusted for mean blood pressure, glycohemoglogin, body mass index, atherogenic index, and smoking years. 95%CI, 95% confidence interval; BA-PWV, brachial-ankle pulse wave velocity; cAI, central augmentation index; CAVI, cardio-ankle vascular index; CF-PWV, carotid-femoral pulse wave velocity.
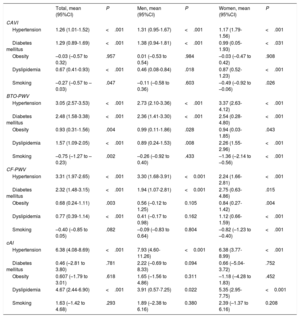
Differences in mean arterial stiffness between individuals with or without CVRFs are summarized in Table 2. Mean values of CAVI, BA-PWV, and CF-PWV were higher in participants with hypertension, diabetes mellitus, or dyslipidemia than in those without these CVRFs; moreover, mean cAI was higher in participants with hypertension or dyslipidemia (but not diabetes mellitus). Mean BA-PWV and CF-PWV were higher in obese than in nonobese individuals. Mean CAVI and BA-PWV were lower in smokers than in nonsmokers.
Differences in vascular function parameters between individuals with and without cardiovascular risk factors in the total sample and by sex
| Total, mean (95%CI) | P | Men, mean (95%CI) | P | Women, mean (95%CI) | P | |
|---|---|---|---|---|---|---|
| CAVI | ||||||
| Hypertension | 1.26 (1.01-1.52) | <.001 | 1.31 (0.95-1.67) | <.001 | 1.17 (1.79-1.56) | <.001 |
| Diabetes mellitus | 1.29 (0.89-1.69) | <.001 | 1.38 (0.94-1.81) | <.001 | 0.99 (0.05-1.93) | <.031 |
| Obesity | –0.03 (–0.57 to 0.32) | .957 | 0.01 (–0.53 to 0.54) | .984 | –0.03 (–0.47 to 0.42) | .908 |
| Dyslipidemia | 0.67 (0.41-0.93) | <.001 | 0.46 (0.08-0.84) | .018 | 0.87 (0.52-1.23) | <.001 |
| Smoking | –0.27 (–0.57 to –0.03) | .047 | –0.11 (–0.58 to 0.36) | .603 | –0.49 (–0.92 to –0.06) | .026 |
| BTO-PWV | ||||||
| Hypertension | 3.05 (2.57-3.53) | <.001 | 2.73 (2.10-3.36) | <.001 | 3.37 (2.63-4.12) | <.001 |
| Diabetes mellitus | 2.48 (1.58-3.38) | <.001 | 2.36 (1.41-3.30) | <.001 | 2.54 (0.28-4.80) | <.001 |
| Obesity | 0.93 (0.31-1.56) | .004 | 0.99 (0.11-1.86) | .028 | 0.94 (0.03-1.85) | .043 |
| Dyslipidemia | 1.57 (1.09-2.05) | <.001 | 0.89 (0.24-1.53) | .008 | 2.26 (1.55-2.96) | <.001 |
| Smoking | –0.75 (–1.27 to –0.23) | .002 | –0.26 (–0.92 to 0.40) | .433 | –1.36 (–2.14 to –0.56) | <.001 |
| CF-PWV | ||||||
| Hypertension | 3.31 (1.97-2.65) | <.001 | 3.30 (1.68-3.91) | <0.001 | 2.24 (1.66-2.81) | <.001 |
| Diabetes mellitus | 2.32 (1.48-3.15) | <.001 | 1.94 (1.07-2.81) | <0.001 | 2.75 (0.63-4.86) | .015 |
| Obesity | 0.68 (0.24-1.11) | .003 | 0.56 (–0.12 to 1.25) | 0.105 | 0.84 (0.27-1.42) | .004 |
| Dyslipidemia | 0.77 (0.39-1.14) | <.001 | 0.41 (–0.17 to 0.98) | 0.162 | 1.12 (0.66-1.59) | <.001 |
| Smoking | –0.40 (–0.85 to 0.05) | .082 | –0.09 (–0.83 to 0.64) | 0.804 | –0.82 (–1.23 to –0.40) | <.001 |
| cAI | ||||||
| Hypertension | 6.38 (4.08-8.69) | <.001 | 7.93 (4.60-11.26) | <0.001 | 6.38 (3.77-8.99) | <.001 |
| Diabetes mellitus | 0.46 (–2.81 to 3.80) | .781 | 2.22 (–0.69 to 8.33) | 0.094 | 0.66 (–5.04-3.72) | .752 |
| Obesity | 0.607 (–1.79 to 3.01) | .618 | 1.65 (–1.56 to 4.86) | 0.311 | –1.18 (–4.28 to 1.83) | .452 |
| Dyslipidemia | 4.67 (2.44-6.90) | <.001 | 3.91 (0.57-7.25) | 0.022 | 5.35 (2.95-7.75) | <0.001 |
| Smoking | 1.63 (–1.42 to 4.68) | .293 | 1.89 (–2.38 to 6.16) | 0.380 | 2.39 (–1.37 to 6.16) | 0.208 |
95%CI, 95% confidence interval; cAI, central augmentation index; CAVI, cardio-ankle vascular index; BA-PWV, brachial-ankle pulse wave velocity; CF-PWV, carotid-femoral pulse wave velocity.
Data are the differences between mean values (95%CI) for vascular function parameters in study participants with and without risk factors. P values refer to differences between study participants with and without risk factors.
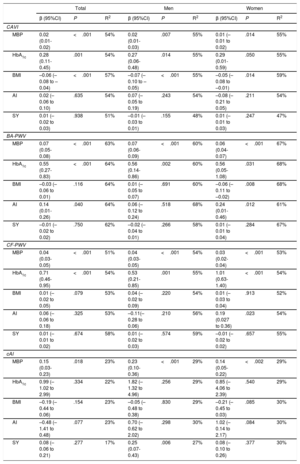
Multiple regression analysis for the total study population and stratified by sex is shown in Table 3. Both in the total population and by sex, mean blood pressure was associated with all arterial stiffness parameters, glycohemoglobin was associated with all parameters except for cAI, and body mass index showed an inverse association with CAVI. In the total study population, atherogenic index was associated with BA-PWV. In women, atherogenic index showed a direct association with BA-PWV and CF-PWV, and body mass index was inversely associated with BA-PWV. In men, smoking years showed a direct association with with cAI.
Cardiovascular risk factors associated with vascular function parameters; multiple regression analysis
| Total | Men | Women | |||||||
|---|---|---|---|---|---|---|---|---|---|
| β (95%CI) | P | R2 | β (95%CI) | P | R2 | β (95%CI) | P | R2 | |
| CAVI | |||||||||
| MBP | 0.02 (0.01-0.02) | <.001 | 54% | 0.02 (0.01-0.03) | .007 | 55% | 0.01 (–0.01 to 0.02) | .014 | 55% |
| HbA1c | 0.28 (0.11-0.45) | .001 | 54% | 0.27 (0.06-0.48) | .014 | 55% | 0.29 (0.01-0.59) | .050 | 55% |
| BMI | –0.06 (–0.08 to –0.04) | <.001 | 57% | –0.07 (–0.10 to –0.05) | <.001 | 55% | –0.05 (–0.08 to –0.01) | .014 | 59% |
| AI | 0.02 (–0.06 to 0.10) | .635 | 54% | 0.07 (–0.05 to 0.19) | .243 | 54% | –0.08 (–0.21 to 0.05) | .211 | 54% |
| SY | 0.01 (–0.02 to 0.03) | .938 | 51% | –0.01 (–0.03 to 0.01) | .155 | 48% | 0.01 (–0.01 to 0.03) | .247 | 47% |
| BA-PWV | |||||||||
| MBP | 0.07 (0.05-0.08) | <.001 | 63% | 0.07 (0.06-0.09) | <.001 | 60% | 0.06 (0.04-0.07) | <.001 | 67% |
| HbA1c | 0.55 (0.27-0.83) | <.001 | 64% | 0.56 (0.14-0.86) | .002 | 60% | 0.56 (0.05-1.08) | .031 | 68% |
| BMI | –0.03 (–0.06 to 0.01) | .116 | 64% | 0.01 (–0.05 to 0.07) | .691 | 60% | –0.06 (–0.11 to –0.02) | .008 | 68% |
| AI | 0.14 (0.01-0.26) | .040 | 64% | 0.06 (–0.12 to 0.24) | .518 | 68% | 0.24 (0.01-0.46) | .012 | 61% |
| SY | –0.01 (–0.02 to 0.02) | .750 | 62% | –0.02 (–0.04 to 0.01) | .266 | 58% | 0.01 (–0.01 to 0.04) | .284 | 67% |
| CF-PWV | |||||||||
| MBP | 0.04 (0.03-0.05) | <.001 | 51% | 0.04 (0.03-0.05) | <.001 | 54% | 0.03 (0.02-0.04) | <.001 | 53% |
| HbA1c | 0.71 (0.46-0.95) | <.001 | 54% | 0.53 (0.21-0.85) | .001 | 55% | 1.01 (0.63-1.40) | <.001 | 54% |
| BMI | 0.01 (–0.02 to 0.05) | .079 | 53% | 0.04 (–0.02 to 0.09) | .220 | 54% | 0.01 (–0.03 to 0.04) | .913 | 52% |
| AI | 0.06 (–0.06 to 0.18) | .325 | 53% | –0.11(–0.28 to 0.06) | .210 | 56% | 0.19 (0.027 to 0.36) | .023 | 54% |
| SY | 0.01 (–0.01 to 0.02) | .674 | 58% | 0.01 (–0.02 to 0.03) | .574 | 59% | –0.01 (–0.02 to 0.02) | .657 | 55% |
| cAI | |||||||||
| MBP | 0.15 (0.03-0.23) | .018 | 23% | 0.23 (0.10-0.36) | <.001 | 29% | 0.14 (0.05-0.22) | <.002 | 29% |
| HbA1c | 0.99 (–1.02 to 2.99) | .334 | 22% | 1.82 (–1.32 to 4.96) | .256 | 29% | 0.85 (–4.06 to 2.39) | .540 | 29% |
| BMI | –0.19 (–0.44 to 0.06) | .154 | 23% | –0.05 (–0.48 to 0.38) | .830 | 29% | –0.21 (–0.45 to 0.03) | .085 | 30% |
| AI | –0.48 (–1.41 to 0.48) | .077 | 23% | 0.70 (–0.62 to 2.02) | .298 | 30% | 1.02 (–0.14 to 2.17) | .084 | 30% |
| SY | 0.08 (–0.06 to 0.21) | .277 | 17% | 0.25 (0.07-0.43) | .006 | 27% | 0.08 (–0.10 to 0.26) | .377 | 30% |
95%CI, 95% confidence interval; AI, atherogenic index; β, regression coefficient; BA-PWV, brachial-ankle pulse wave velocity; BMI, body mass index; cAI, central augmentation index; CAVI, cardio-ankle vascular index; CF-PWV, carotid-femoral pulse wave velocity; HbA1c, glycohemoglobin; MBP, mean blood pressure; SY, smoking years.
Dependent variables in the multiple regression analysis were CAVI, BA-PWV, CF-PWV, and cAI, independent variables were cardiovascular risk factors (MBP, HbA1c, BMI, AI, and SY), and adjustment variables were age and pharmacotherapy with hypotensive, hypoglycemic, and hypolipidemic drugs.
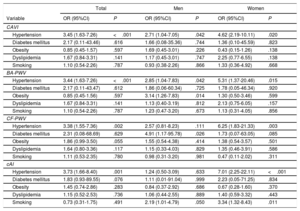
Logistic regression analysis for the total study population and stratified by sex is shown in Table 4. In the total population, hypertension was associated with high values of CAVI (OR=3.45), BA-PWV (OR=3.44), CF-PWV (OR=3.38), and cAI (OR=3.73). In women, smoking was associated with high values of CAVI (OR=3.34). In men, diabetes showed a direct association with CF-PWV (OR=4.91).
Cardiovascular risk factors associated with elevated values of vascular function parameters. Logistic regression analysis
| Total | Men | Women | ||||
|---|---|---|---|---|---|---|
| Variable | OR (95%CI) | P | OR (95%CI) | P | OR (95%CI) | P |
| CAVI | ||||||
| Hypertension | 3.45 (1.63-7.26) | <.001 | 2.71 (1.04-7.05) | .042 | 4.62 (2.19-10.11) | .020 |
| Diabetes mellitus | 2.17 (0.11-43.46) | .616 | 1.66 (0.08-35.36) | .744 | 1.36 (0.10-45.59) | .823 |
| Obesity | 0.85 (0.45-1.57) | .597 | 1.69 (0.45-3.01) | .226 | 0.43 (0.15-1.26) | .138 |
| Dyslipidemia | 1.67 (0.84-3.31) | .141 | 1.17 (0.45-3.01) | .747 | 2.25 (0.77-6.55) | .138 |
| Smoking | 1.10 (0.54-2.26) | .787 | 0.93 (0.38-2.26) | .866 | 1.33 (0.36-4.92) | .668 |
| BA-PWV | ||||||
| Hypertension | 3.44 (1.63-7.26) | <.001 | 2.85 (1.04-7.83) | .042 | 5.31 (1.37-20.46) | .015 |
| Diabetes mellitus | 2.17 (0.11-43.47) | .612 | 1.86 (0.06-60.34) | .725 | 1.78 (0.05-46.34) | .920 |
| Obesity | 0.85 (0.45-1.56) | .597 | 3.14 (1.26-7.83) | .014 | 1.30 (0.50-3.46) | .599 |
| Dyslipidemia | 1.67 (0.84-3.31) | .141 | 1.13 (0.40-3.19) | .812 | 2.13 (0.75-6.05) | .157 |
| Smoking | 1.10 (0.54-2.26) | .787 | 1.23 (0.47-3.20) | .673 | 1.13 (0.31-4.05) | .856 |
| CF-PWV | ||||||
| Hypertension | 3.38 (1.55-7.36) | .002 | 2.57 (0.81-8.23) | .111 | 6.25 (1.83-21.33) | .003 |
| Diabetes mellitus | 2.31 (0.08-68.69) | .629 | 4.91 (1.17-95.78) | .026 | 1.73 (0.07-63.05) | .085 |
| Obesity | 1.86 (0.99-3.50) | .055 | 1.55 (0.54-4.38) | .414 | 1.38 (0.54-3.57) | .501 |
| Dyslipidemia | 1.64 (0.80-3.36) | .117 | 1.15 (0.33-4.03) | .829 | 1.35 (0.46-3.91) | .586 |
| Smoking | 1.11 (0.53-2.35) | .780 | 0.98 (0.31-3.20) | .981 | 0.47 (0.11-2.02) | .311 |
| cAI | ||||||
| Hypertension | 3.73 (1.66-8.40) | .001 | 1.24 (0.50-3.09) | .633 | 7.01 (2.25-22.11) | <.001 |
| Diabetes mellitus | 1.83 (0.93-89.55) | .076 | 1.11 (0.01-91.04) | .999 | 2.23 (0.05-71.25) | .834 |
| Obesity | 1.45 (0.74-2.86) | .283 | 0.84 (0.37-2.92) | .686 | 0.67 (0.28-1.60) | .370 |
| Dyslipidemia | 1.15 (0.52-2.53) | .736 | 1.06 (0.44-2.55) | .889 | 1.40 (0.59-3.32) | .443 |
| Smoking | 0.73 (0.31-1.75) | .491 | 2.19 (1.01-4.79) | .050 | 3.34 (1.32-8.43) | .011 |
95%CI, 95% confidence interval; BA-PWV, brachial-ankle pulse wave velocity; cAI, central augmentation index; CAVI, cardio-ankle vascular index; CF-PWV, carotid-femoral pulse wave velocity; OR, odds ratio.
Dependent variables in the logistic regression analysis were CAVI ≥ 9, BA-PWV ≥ 14.50 m/s, CF-PWV ≥ 7.5 m/s, and cAI ≥ 35%; independent variables were cardiovascular risk factors (hypertension, diabetes mellitus, obesity, dyslipidemia, and smoking); and adjustment variables were age, pharmacotherapy with hypotensive, hypoglycemic, and hypolipidemic drugs, and cardiovascular risk factors. For risk factors, 1=presence and 0=absence.
The explanatory power of age, sex, and mean blood pressure was 62% for BA-PWV, 49% for CF-PWV, 54% for CAVI, and 38% for cAI, and there was no notable increase upon incorporation of other CVRFs into the model (Table 5).
Regression equation for the different vascular function parameters in the total study population
| Category | CAVI | R2 | ΔR2 |
|---|---|---|---|
| Model 1 | CAVI=3.92+0.073×age | 0.52 | 0.52 |
| Model 2 | CAVI=3.79+0.073×age+0.26×sex | 0.53 | 0.01 |
| Model 3 | CAVI=2.81+0.07×age+0.17×sex+0.01×MBP | 0.54 | 0.01 |
| Model 4 | CAVI=2.75+0.07×age+0.17×sex+0.01×MBP+0.14×smoking status | 0.54 | <0.01 |
| Model 5 | CAVI=2.83+0.07×age+0.14×sex+0.01×MBP+0.13×smoking status+0.51×diabetes | 0.54 | <0.01 |
| Model 6 | CAVI=2.86+0.07×age+0.14×sex+0.01×MBP+0.12×smoking status+0.49×diabetes+0.11×dyslipidemia | 0.54 | <0.01 |
| Model 7 | CAVI=2.75+0.07×age+0.12×sex+0.02×MBP+0.11×smoking status+0.19×diabetes+0.14×dyslipidemia – 0.36×obesity | 0.55 | 0.01 |
| BA-PWV | |||
|---|---|---|---|
| Model 1 | BA-PWV=5.27+0.14×age | 0.53 | 0.53 |
| Model 2 | BA-PWV=5.06+0.14×age+0.44×sex | 0.54 | 0.01 |
| Model 3 | BA-PWV=0.15+0.12×age+0.01×sex+0.07×MBP | 0.62 | 0.08 |
| Model 4 | BA-PWV=0.14+0.12×age+0.01×sex+0.07×MBP+0.04×smoking status | 0.62 | <0.01 |
| Model 5 | BA-PWV=0.29+0.12×age – 0.01×sex+0.07×MBP+0.03×smoking status+1.04×diabetes | 0.63 | 0.01 |
| Model 6 | BA-PWV=0.43+0.11×age – 0.04×sex+0.05×MBP+0.03×smoking status+0.94×diabetes+0.51×dyslipidemia | 0.64 | 0.01 |
| Model 7 | BA-PWV=0.45+0.11×age – 0.03×sex+0.07×MBP+0.03×smoking status+0.94 diabetes+0.50×dyslipidemia+0.10×obesity | 0.64 | 0.01 |
| CF-PWV | |||
|---|---|---|---|
| Model 1 | CF-PWV=1.42+0.09×age | 0.41 | 0.41 |
| Model 2 | CF-PWV=1.09+0.09×age+0.66×sex | 0.44 | 0.03 |
| Model 3 | CF-PWV=–1.75+0.08×age+0.41×sex+0.04×MBP | 0.49 | 0.06 |
| Model 4 | CF-PWV=–1.80+0.08×age+0.41×sex+0.04×MBP+0.12×smoking status | 0.49 | <0.01 |
| Model 5 | CF-PWV=–1.63+0.08×age+0.34×sex+0.04×MBP+0.13×smoking status+1.31×diabetes | 0.51 | 0.02 |
| Model 6 | CF-PWV=–1.63+0.08×age+0.34×sex+0.04×MBP+0.13×smoking status+1.32×diabetes+0.02×dyslipidemia | 0.51 | <0.01 |
| Model 7 | CF-PWV=–1.57+0.08×age+0.35×sex+0.04×MBP+0.14×smoking status+1.32×diabetes - 0.04×dyslipidemia+0.24×obesity | 0.51 | <0.01 |
| cAI | |||
|---|---|---|---|
| Model 1 | cAI=3.19+0.42×age | 0.22 | 0.22 |
| Model 2 | cAI=7.80+0.42×age – 9.52×sex | 0.36 | 0.14 |
| Model 3 | cAI=–4.18+0.38×age – 10.54×sex+0.17×MBP | 0.38 | 0.02 |
| Model 4 | cAI=–6.27+0.40×age – 10.71×sex+0.17×MBP+4.73×smoking status | 0.40 | 0.02 |
| Model 5 | cAI=–6.54+0.41×age – 10.60×sex+0.17×MBP+4.72×smoking status – 2.06×diabetes | 0.40 | <0.01 |
| Model 6 | cAI=–6.23+0.40×age – 10.56×sex+0.17×MBP+4.57×smoking status – 2.28×diabetes+1.21×dyslipidemia | 0.40 | <0.01 |
| Model 7 | cAI=–6.84+0.40×age – 10.69×sex+0.18×MBP+4.50×smoking status – 2.28×diabetes+1.38×dyslipidemia – 2.15×obesity | 0.40 | <0.01 |
ΔR2, increase in the coefficient of determination; BA-PWV, brachial-ankle pulse wave velocity; cAI, central augmentation index; CAVI, cardio-ankle vascular index; CF-PWV, carotid-femoral pulse wave velocity; MBP, mean blood pressure; R2, coefficient of determination;
Sex: 1=man, 0=woman. Variables added in each model: 1 age, 2 sex, 3 mean blood pressure, 4 smoking status, 5 diabetes mellitus, 6 dyslipidemia, and 7 obesity.
This is the first study to establish reference values for 4 arterial stiffness parameters in a randomly sampled Spanish population with no signs of cardiovascular disease. With the exception of cAI, the arterial stiffness parameters showed a positive association with age and blood pressure. The association with CVRFs varied according to the parameter and sex, indicating that the influence of CVRFs on arterial stiffness parameters is nonuniform.
The CAVI values reported here are lower than those published in the REGICOR study,13 probably because the prevalence of CVRFs in REGICOR was higher and also because the authors considered the highest CAVI value for analysis, rather than the mean value used here. Our mean CAVI values are also lower than those reported in a Czech population older than 50 years21; however, that study excluded people with diabetes or under treatment with hypotensive or hypolipidemic drugs. Our values are similar to those reported in populations in Japan and China12,22; however, the Japanese study excluded individuals with hypertension, diabetes, nephritis and gout, and the population was not randomly selected.
The values of BA-PWV in our cohort are lower than those reported in a Chinese population11 (by 1.2 m/s and 1.5 m/s for participants in their 50s and 40s, respectively). These differences might reflect the higher prevalence of CVRFs in the Chinese study; however, BA-PWV was also higher in the Chinese subpopulation without CVRFs (by 0.8 m/s and 1.5 m/s in participants in their 50s and 40s, respectively).11
Mean CF-PWV values in our population were lower (by between 0.8 m/s and 1.5 m/s) than those reported in 13 centers in 8 European countries.6 Our CF-PWV values are also lower than recently reported values from a Spanish population older than 65 years (mean age, 72.9 years; median CF-PWV in participants older than 75 years, 10.0 m/s); however, a major limitation of that study is that CF-PWV was not measured by tonometry.10 Other methodological differences should also be considered. Our study analyzed a randomly selected population showing no signs of overt cardiovascular disease; moreover, all measures were recorded with the same device and using the same technique. In contrast, the European study was a retrospective analysis of several databases and excluded individuals with diabetes or taking hypoglycemic or hypolipidemic drugs.6 Nevertheless, these observations appear insufficient to explain the differences with respect to our results, and these differences are likely to reflect other factors related to life style, the environment, and genetics.
Our cAI values are lower than those reported for a Korean population and were higher in women, as reported in other studies.1,14 It should be noted that some authors do not regard cAI as a precise measure of arterial stiffness because it is influenced by cardiac frequency and height and declines with advancing age.23
In line with previous studies,6,13,15,16 arterial stiffness measures in our population were higher in participants with diabetes or hypertension, both in the total population and by sex. We consider that the size of the differences between participants with and without CVRFs is clinically relevant for hypertension (for BA-PWV, CF-PWV, and cAI), diabetes (for BA-PWV and CF-PWV), and dyslipidemia (for cAI).
However, some of the comparisons for diabetes did not reach statistical significance, probably due to a lack of statistical power, given that the study population included only 38 people with diabetes (26 men and 12 women).
The association with obesity varied according to the arterial stiffness parameter used; for CAVI, there was an inverse correlation, as reported previously.24 The sex differences found in the logistic regression may reflect the influence of estrogens, as well as differences in height and body-fat distribution25 and inflammatory factors.26 Obesity showed a positive correlation with CF-PWV, and while this trend did not reach statistical significance, it is in line with the results of the Whitehall II study.27
Zhao et al.28 found an independent association between cholesterol and CF-PWV, whereas in our analysis atherogenic index showed an association only with CF-PWV in women, in line with the results published by Elosua et al.13 Nevertheless, other studies have shown no association between these variables.6,11 The independence of arterial stiffness from dyslipidemia is also supported by recently published data on CAVI.15,22 Kim et al.1 concluded that dyslipidemia contributes to increased arterial stiffness in women but not in men, and proposed that arteries in women may be more vulnerable to CVRFs than those in men. These discrepancies in the data may be related to differences in the definition of dyslipidemia used, as well as the inclusion of patients treated with hypolipidemic drugs.
Smoking is a major CVRF and one of the main causes of preventable death in developed countries. This increased risk is linked to the higher cAI in women who smoke. A lack of association between smoking and CAVI has been reported in a Mediterranean population13; however, this result may reflect the cross-sectional study design or the possible inclusion of participants who had recently stopped smoking.
In summary, the main novelty of this study is the analysis of 4 arterial stiffness parameters in the same randomly sampled population. The differences between these parameters in the study population likely reflect the fact that each analyzed arterial stiffness in distinct branches of the arterial tree, and recorded values will thus reflect the different structural properties and elasticities of the central and peripheral arteries.
The detected sex differences may be related to the higher arterial stiffness in girls before puberty, whereas in boys arterial stiffness shows a linear increase from puberty onward. Arteries are thus instrinsically stiffer in women, but this is mitigated by the effects of sex steroid hormones during reproductive life. Between-population differences can be influenced not only by the prevalence of classic CVRFs and life style, but also by environmental and genetic factors. The results of the present study will help to define thresholds for the clinical identification of patients with increased arterial stiffness.
Limitations and strengthsThe main limitations of the present study are its cross-sectional design, which makes it impossible to establish causality, and the consideration of only classic CVRFs, thus providing no information about the effect of other risk factors on arterial stiffness. The study cohort was selected from an urban population, which may not be representative of the overall Spanish population. Moreover, the study population excluded individuals younger than 35 years and older than 75 years and was exclusively Caucasian. Major strengths of the study include the use of a randomly sampled population and the analysis of 4 arterial stiffness parameters, ensuring robustness to the results obtained.
CONCLUSIONSAll 4 arterial stiffness parameters increased with age. CAVI and CF-PWV were higher in men, cAI was higher in women, and there was no sex difference in BA-PWV. These results show that the use of published values obtained in other countries and population contexts can lead to overestimation of the values in the Spanish population.
FUNDINGThis project was funded by the MICINN (Ministerio de Ciencia, Innovación y Universidades), the ISCIII/ERDF (Instituto de Salud Carlos III/European Regional Development Fund) (Red RedIAPP, RD12/0005, RD16/0007), the Castile and León regional health directorate (GRS 1193/B/15) and the research activity intensification program (INT/M/02/17 and INT/M/04/15).
CONFLICTS OF INTERESTNone declared.
- –
Arterial stiffness is an early indicator of atherosclerosis progression.
- –
Arterial stiffness can be measured by several noninasive methods.
- –
The current recommended parameter in western countries is CF-PWV, but this variable depends on blood pressure at the time of measurement.
- –
This is the first study to analyze 4 arterial stiffness parameters in a single sample of the Spanish population.
- –
Mean values of the analyzed parameters stratified by age and sex are lower than those published in other studies.
- –
The association of CVRFs with arterial stiffness differs according to the parameter measured and biological sex.
Manuel A. Gómez-Marcos, Luis García-Ortiz, José I. Recio-Rodríguez, Carlos Martínez-Salgado, Jesùs M. Hernández-Rivas, Rogelio González-Sarmiento, Pedro L. Sánchez-Fernández, Emiliano Rodríguez-Sánchez, M. Carmen Patino-Alonso, José A. Maderuelo-Fernández, Leticia Gómez-Sánchez, Jesús González-Sánchez, Rosario Alonso-Domínguez, Carmela Rodríguez-Martín, Marta Gómez-Sánchez, Ángela de Cabo-Laso, Benigna Sánchez-Salgado, Natalia Sánchez Aguadero, Sara Mora-Simón, José Ramón González-Porras, José María Bastida-Bermejo, and Isabel Fuentes-Calvo.
Supplementary data associated with this article can be found in the online version, at https://doi.org/10.1016/j.rec.2019.04.016