The role of the environment on cardiovascular health is becoming more prominent in the context of global change. The aim of this study was to analyze the relationship between apparent temperature (AT) and air pollutants and acute myocardial infarction (AMI) and to study the temporal pattern of this disease and its associated mortality.
MethodsWe performed a time-series study of admissions for AMI in Cantabria between 2001 and 2015. The association between environmental variables (including a biometeorological index, AT) and AMI was analyzed using a quasi-Poisson regression model. To assess potential delayed and non-linear effects of these variables on AMI, a lag non-linear model was fitted in a generalized additive model.
ResultsThe incidence rate and the mortality followed a downward trend during the study period (CC=–0.714; P=.0002). An annual pattern was found in hospital admissions (P=.005), with the highest values being registered in winter; a weekly trend was also identified, reaching a minimum during the weekends (P=.000005). There was an inverse association between AT and the number of hospital admissions due to AMI and a direct association with particulate matter with a diameter smaller than 10 μm.
ConclusionsHospital admissions for AMI followed a downward trend between 2007 and 2015. Mortality associated with admissions due to this diagnosis has decreased. Predictive factors for this disease were AT and particulate matter with a diameter smaller than 10 μm.
Keywords
Ischemic heart disease (IHD) is one of the main causes of morbidity and mortality in the world, responsible for more than 7 million deaths annually. The mortality rate due to IHD began to increase from the beginning of the 20th century, but in most industrialized countries this trend has gone into reverse in the last 30 years.1,2 In contrast, in many middle- and low-income countries mortality due to IHD has continued to increase. This is due to the lack of access in these countries to diagnostic and therapeutic resources and poorer control of modifiable risk factors such as unhealthy eating habits, physical inactivity, overweight and obesity, smoking, diabetes mellitus, high blood pressure, and dyslipidemia.3
Historically, the effects of these modifiable risk factors has been studied in depth, but now the influence of the environment on cardiovascular health is gaining increasing attention in the context of global environmental change. The World Health Organization estimates that 24% of worldwide morbidity and 23% of mortality is attributable to environmental factors. Given that human beings interact continuously with the environment, variables such as air pollutants and meteorological conditions are potential predictors of cardiovascular morbidity and mortality.4,5
Biometeorological indices provide a measure of the combined effect of a set of environmental variables on human health and wellbeing. The biometeorological index apparent temperature (AT)6 estimates the human perception of temperature and has been identified by some authors as the main predictor of heat-related mortality.7 To date there have been no reports of the relationship between AT and cardiovascular morbidity.
The present study analyzed the relationship of AT and major air pollutants with hospital admissions for acute myocardial infarction (AMI) in Cantabria, a coastal region in northern Spain. The study also included analysis of patient demographic characteristics and associated mortality, as well as a temporal analysis to identify the disease seasonality and long-term trends in relation to findings from other countries.
METHODSThe study was divided into 2 phases. The first phase was a descriptive study of AMI admissions and associated mortality at the Marqués de Valdecilla University Hospital (HUMV in its Spanish initials). The HUMV is the referral center in Cantabria and the only hospital in the region with an acute coronary unit. The second phase was a retrospective correlation analysis to determine the relationship between admissions for AMI and various environmental factors.
Health Care, Mortality, and Demographic DataDaily AMI admissions data for the HUMV were obtained for the period from January 1, 2001 to December 31, 2015. The admissions data were categorized according to the International Classification of Diseases, ninth revision (ICD-9 410 – AMI).
In addition to admission date, the records included patient age, sex, and discharge destination.
Data on mortality due to AMI in Cantabria for the same period were provided by the Cantabrian Institute of Statistics (categorized according to the ICD, tenth revision code; ICD-10 I21 – AMI).
Mandatory weekly reports of influenza infections were provided by the Cantabrian Department of Public Health.
Environmental DataDaily records of major air pollutants were collected in the city of Santander during the study period (January 1, 2001 to December 31, 2015); the recorded pollutants were CO, NO2, SO2, and particulate matter with a diameter <10μm [PM10]. The pollutant levels were those recorded by the Tetuán permanent air pollution monitoring station. This urban monitoring station is strategically located in the city center and thus provides a representative profile of the pollutants to which the population is exposed. These data were provided by the Cantabrian Center for Environmental Research.
Meteorological data were obtained from the Spanish State Meteorological Agency. The data analyzed were recorded at the Santander I, CMT monitoring station, which provides the most comprehensive historical records for the city.
Apparent TemperatureAT is a biometeorological index that incorporates air temperature, humidity, and wind speed.
Mean AT is calculated from these meteorological variables using the formula proposed by R. Steadman (1984)8:

where T is the temperature in °C, Pv is the water vapor pressure (hPa), and V10 is the wind speed 10 m above the ground.
Water vapor pressure (Pv) was estimated with the following equation:

where rh is the percent relative humidity.
Statistical AnalysisMonth-to-month and day-to-day differences were evaluated by analysis of variance. The annual incidence trend was calculated using the Kendall nonparametric Tau b test.
To evaluate the association between environmental variables and AMI admissions, we developed a distributed lag nonlinear model. In the time-series of pollutant data, 6.2% of values were missing. The missing values were concentrated in 2001 and 2002, prompting us to exclude these years from the analysis.
The distributed lag nonlinear model simultaneously describes complex nonlinear and delayed effects of an environmental variable on a response variable within generalized linear models, generalized additive models, or generalized estimating equations. The statistical details of the model have been described by Bhaskaran et al.9 and Gasparrini et al.10
The health effects of environmental variables are not always immediate, and lag periods have been reported of days or even weeks.11 To model the effect of AT and air pollutants we considered a 14-day lag period.12–15 A quasi-Poisson regression was enacted within a generalized additive model.
To evaluate the effect of AT, a first model was developed according to the following formula:

In this model, the potential confounding effects of pollutants were adjusted for by including the pollutant PM10, which was considered representative of the overall pollution level.
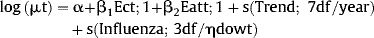
The second model was designed to evaluate the effect of each pollutant as an exposure variable according to the formula

where t is the observation day; Yt is the number of recorded admissions on day t; α is the intersection; Eatt;l, EPM10t;l, and Ect;l are the matrices obtained after applying the distributed lag nonlinear model to AT and the air pollutants; βi represents the coefficient vectors for these matrices; l is the lag in days; s(…) is a thin plate regression spline; trend is the long-term trend and seasonality on a natural cubic timescale with 7 degrees of freedom (df) per year; dow is the day of the week on day t, and η represents the coefficient vectors. The reference day of the week was Sunday.
Influenza is the number of cases of influenza, included with 3 df to smooth the effect of daily fluctuations, a possible confounder. For the rate of influenza infection, a locally weighted polynomial regression (LOESS) was used to extrapolate weekly data and obtain an estimate of daily data. We chose a14-day smoothing window, which corresponds to a behavior close to that of the reported cases.
The numbers of df for independent variables were selected according to the Akaike information criterion. The model assumed that the effect of exposure to the environmental variables was linear, and the lag effect was constructed using a 3 df cubic B-spline.
Model development, statistical analysis, and graph preparation were performed in R version 3.3. Models were analyzed with the software packages mgcv (version 1.8-15) and dlnm (version 2.2.6).
RESULTSDemographic Characteristics and Discharge Destination of Patients Diagnosed With Acute Myocardial Infarction in CantabriaDuring the 15-year study period, there were 9871 admissions for AMI at the HUMV; 71% of the patients were men. The mean incidence rate during the analysis period was 116 infarctions/100 000 inhabitants of Cantabria (men, 167/100 000; women, 66/100 000). The mean age of admitted AMI patients was 68 years. Of the admitted patients, 57% were aged 45 to 75 years, 38% were older than 75 years, and 5% were younger than 45 years. The age distribution differed between men and women; most male patients were aged 45 to 75 years (63% of male admissions), whereas most female patients were older than 75 years (57% of female admissions).
Of the patients included in the analysis, 87% were discharged to their homes, 9% died during hospitalization, 3% were transferred to the ward or to another hospital, and fewer than 1% self discharged.
The proportion of patients who died after admission for AMI was higher among women (14% of women vs 8% of men).
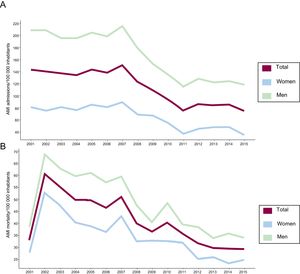
Time-series Analysis of Acute Myocardial InfarctionThe year-on-year analysis showed that the number of patient admissions for AMI at the HUMV was relatively stable during the the period from 2001 to 2006, followed in 2007 by an incidence peak of 867 admissions and a rate of 151 infarctions/100 000 inhabitants. In subsequent years, there was a statistically significant downward trend, with a correlation coefficient (CC)=–0.714; P=.0002 (Figure 1A).
 in Cantabria, 2001-2015. B, Annual AMI mortality per 100 000 inhabitants (total and by sex) in Cantabria, 2001-2015. AMI, acute myocardial infarction.")
The number of AMI deaths/100 000 inhabitants in Cantabria also showed a statistically significant downward trend (CC=–0.714; P=.0002) (Figure 1B).
Similarly, a statistically significant downward trend was found for the percentage of admitted patients who died in the study period (CC=–0.562; P=.004). Around 10% of admitted patients died during the first half of the study period. The peak mortality was recorded in 2007, at almost 12%. The mortality rate decreased in subsequent years, reaching a minimum in 2015, when 6.7% of patients admitted for AMI died).
The monthly admission pattern revealed statistically significant seasonal differences (P=.021). Admissions peaked in the first months of the year, with the maximum mean number of admissions being recorded in February (1.95 admissions/d). The rate decreased during the spring to a minimum of 1.67 admissions/d in May and June.
Patient outcome also showed a statistically significant seasonal variation (P=.005). Mortality exceeded 10% in the colder months (January, February, November, and December), and the minimum mortality was recorded in August, when 7.8% of admitted patients died.
The weekly distribution of AMI admissions also showed statistically significant differences (P=.000005). Admissions were higher on working days than at the weekend, with a peak on Tuesdays (mean 1.94 admissions/d) and a minimum on Saturdays (1.6 admissions/d). Mortality due to AMI showed no statistically significant association with the day of admission, although the percentage mortality peaked at the weekend and reached a minimum on Thursdays.
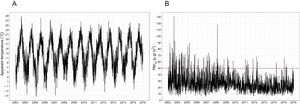
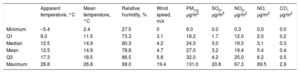
Analysis of the Relationship Between Environmental Factors and Acute Myocardial InfarctionThe daily series of AT and PM10 during the 13-year study period are shown in Figure 2. A statistical summary of AT over the study period and the variables involved in its calculation is shown in Table 1.

A, Daily time-series of apparent temperature in Santander, 2003 to 2015. B, Daily time-series of PM10 at the Tetuán monitoring station, Santander, 2003-2015. The dashed horizontal line marks the mean 24-hour health safety limit. PM10, particulate material with a diameter <10μm. Years are indicated on the horizontal axis.
Distribution of Apparent Temperature, Its Component Variables, and Air Pollutants in Santander for the Period 2010-2015
| Apparent temperature, °C | Mean temperature, °C | Relative humidity, % | Wind speed, m/s | PM10, μg/m3 | SO2, μg/m3 | NO2, μg/m3 | NO, μg/m3 | CO, μg/m3 | |
|---|---|---|---|---|---|---|---|---|---|
| Minimum | –5.4 | 2.4 | 27.5 | 0 | 6.0 | 0.0 | 0.3 | 0.0 | 0.0 |
| Q1 | 8.0 | 11.5 | 73.3 | 3.1 | 18.2 | 1.7 | 12.0 | 2.0 | 0.2 |
| Median | 12.5 | 14.9 | 80.3 | 4.2 | 24.0 | 3.0 | 18.0 | 3.1 | 0.3 |
| Mean | 12.5 | 14.9 | 78.8 | 4.7 | 27.0 | 3.2 | 19.4 | 5.4 | 0.4 |
| Q3 | 17.3 | 18.5 | 86.5 | 5.8 | 32.0 | 4.2 | 25.0 | 6.2 | 0.5 |
| Maximum | 28.8 | 26.8 | 99.0 | 19.4 | 131.0 | 20.8 | 67.3 | 69.5 | 2.9 |
CO, carbon monoxide; NO, nitrogen monoxide; NO2, nitrogen dioxide; PM10, particulate material with a diameter < 10μm; Q1, first quartile; Q3, third quartile; SO2, sulfur dioxide.
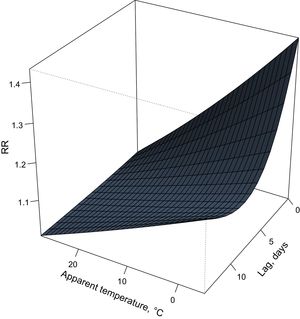
The analysis shows an inverse and statistically significant association between AT and the number of admissions for AMI on the day of exposure to low AT (Figure 3). The effect was more pronounced on the day of exposure, and there was a quasi-direct effect in the days immediately following exposure to low temperatures.
 over a postexposure lag of 14 days. RR, relative risk.")
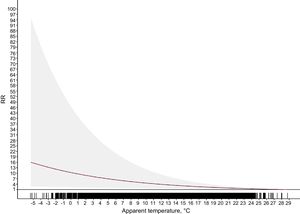
The cumulative relative risk over lag days 0 to 14 is shown in Figure 4. The relationship between risk and lag time was nonlinear; for AT values of 8°C and 4.7°C (the 10th and 25th percentiles), the cumulative relative risk of AMI was 5.4 (95% confidence interval [95%CI], 1.82-15.98) and 7.07 (95%CI, 2.01-24.89), respectively.
 of daily admissions for acute myocardial infarction as a function of apparent temperature in Cantabria. RR, relative risk. The shaded area indicates the 95% confidence interval.")
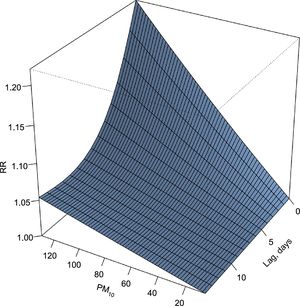
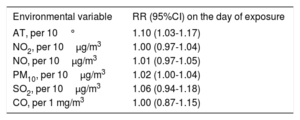
Of the air pollutants analyzed, PM10 showed a direct and statistically significant relationship with AMI risk in the first days after exposure (lag days 0-2). On the day of exposure the relative risk was 1.02 (95%CI, 1.00-1.04) for each 10μg/m3 increase in PM10 concentration (Figure 5). In contrast, the other air pollutants showed no association with AMI admissions (Table 2).
 over a postexposure lag of 14 days. PM10, particulate material with a diameter < 10μm; RR, relative risk.")
Relative Risk of Admission for Acute Myocardial Infarction in Cantabria According to Air Pollutant Concentrations
| Environmental variable | RR (95%CI) on the day of exposure |
|---|---|
| AT, per 10° | 1.10 (1.03-1.17) |
| NO2, per 10μg/m3 | 1.00 (0.97-1.04) |
| NO, per 10μg/m3 | 1.01 (0.97-1.05) |
| PM10, per 10μg/m3 | 1.02 (1.00-1.04) |
| SO2, per 10μg/m3 | 1.06 (0.94-1.18) |
| CO, per 1 mg/m3 | 1.00 (0.87-1.15) |
95%CI, 95% confidence interval; AT, apparent temperature;CO, carbon monoxide; NO, nitrogen monoxide; NO2, nitrogen dioxide; PM10, particulate material with a diameter < 10μm; RR, relative risk; SO2, sulfur dioxide.
This is the first study to analyze the effect of the biometeorological index AT on the incidence of AMI in Europe. Given that AT is considered the best predictor of heat-related mortality,7 AT-related mortality data have strong potential as a prevention tool, and this forms the main focus of this discussion.
A downward trend in hospital admissions for AMI has been reported in several countries,16,17 and has generally been attributed to the success of primary prevention measures, which have produced decreases in smoking rates, systolic blood pressure, total cholesterol, and physical inactivity.18 This trend has been noted in several Spanish regions,19 and some authors have highlighted specific factors that may be important in the national context. One proposed factor is an increased uptake of a Mediterranean diet rich in virgin olive oil and nuts due to greater awareness of its health benefits for those at cardiovascular risk.20 Another likely important factor is the enactment of legislation on January 1, 2006 to restrict the sale, supply, consumption, and advertising of tobacco products (Ley 8/2005, de 26 de diciembre). The introduction of these restrictions has been associated with a decreased incidence of infarctions among active and passive smokers in Spain.21
The downward trend in mortality due to cerebrovascular disease and especially AMI in the United States, Canada, and western European countries has been attributed to the inclusion of troponins in diagnosis and the general improvement in treatment strategies. Moreover, some authors propose that the decrease in cardiovascular mortality reflects improvements in blood pressure control in recent years.22,23
The weekly pattern showed a higher admission rate from Monday to Friday; however, the most interesting result is the absence of significantly increased mortality at the weekend. Several studies have reported increased mortality among AMI patients admitted at the weekend, and this effect has been linked to lower resource availability and subsequent delays in effective treatment initiation.24 Supporting this idea, a recent UK study found no weekend mortality spike in hospitals with a specialized cardiology unit providing a full service 7 days a week.25
Other studies have reported peak AMI incidence in winter in a variety of climates.26,27 However, the available data are not fully consistent, with a higher incidence reported for the warmer months in some tropical regions, suggesting an influence of climate type.28
The study of admissions for AMI is considered a useful means of evaluating the impact of low temperatures on health.29,30 In these studies, it is important to recognize that a direct or inverse association of morbidity and mortality with temperature can be influenced by factors such as the geographic conditions of the country or region, specific population characteristics such as heat sensitivity, and adaptive measures.10,31 In the present study, we evaluated the effects of AT (rather than maximum, mean, or minimum temperature) because this measure attempts to capture the reaction of the human body to the combined conditions of the thermal environment. The human body is simultaneously exposed to a multitude of atmospheric parameters and maintains body temperature by regulating heat emission. Highly humid conditions impede evaporation and induce feelings of discomfort. Humidity is included as a variable in the calculation of AT.
A recent Portuguese study examined the association between AMI admissions and another biometeorological index, Physiologically Equivalent Temperature (PET).32,33 Like AT, PET incorporates temperature, humidity, and wind speed and provides a measure of the intensity of thermoregulation required to maintain bodily comfort. However, PET differs from AT in important respects; whereas AT is an empirical measure, PET is based on a model of bodily energy balance and incorporates the effect of solar radiation. Nonetheless, the measures are comparable, and the results of the Portuguese study are in agreement with our findings, showing an association between exposure to low temperatures and hospital admission for AMI.
These results support the controversial idea that low temperature exposure is prejudicial to human health even in countries with a mild cold season.34
An association between low temperatures and the incidence of AMI has also been reported for other European countries with climates less similar to Spain.35,36
The direct relationship between AMI admissions and PM10 is in line with findings in other locations. PM10 includes a proportion of anthropogenic materials (organic and secondary inorganic compounds) that are damaging to health upon short-term exposure. This material can be directly toxic to the circulatory system since the soluble particle components cross the alveolar epithelium; however, the deleterious effects usually act through indirect mechanisms involving the stimulation of oxidative stress (pulmonary and systemic) and inflammation. Moreover, vascular inflammation can activate a cascade of prothrombotic events, alter autonomic nervous system function (with effects on heart rate), and cause endothelial dysfunction.37 Air quality in Cantabria is good, with pollutants rarely exceeding World Health Organization limits,38 and this may explain the absence of a statistically significant relationship with other major air pollutants. However, this lack of association could also reflect certain study limitations. For example, the air pollutant data analyzed in this study came from a single monitoring station. This station was selected as the most appropriate for this type of study due to its general characteristics (urban and with a complete historical record) and specific location in the center of the largest city of the region. However, Cantabria contains a number of contrasting environments, including high traffic areas, industrial neighborhoods, rural and urban zones, and areas of low and high altitude. In these different areas, the pollutant concentrations to which people are exposed likely differ from those considered here as the most representative. The study is also limited by the small sample size, which reflects the small population of Cantabria and the correspondingly low number of AMI admissions.
It would have been interesting to analyze the effect of particulate matter with a smaller diameter (PM2.5). However, pollution monitoring stations in Santander did not begin recording this variable until 2009, and PM2.5 monitoring since then has not been continuous. It was therefore not possible to consider the effect of PM2.5.
CONCLUSIONSThe findings presented here indicate that environmental factors make an important contribution to mortality due to AMI. Further research directed at understanding these effects is essential for the development of prevention strategies.
CONFLICTS OF INTERESTNone declared.
- –
Environmental factors account for an estimated 24% of global morbidity and 23% of global mortality.
- –
The biometeorological index AT estimates individually perceived temperature and is considered a good predictor of heat-related mortality.
- –
This study is the first to examine the effect of AT as a biometeorological indicator of AMI in Spain and, to our knowledge, in Europe.
- –
A detailed analysis is presented of the temporal pattern of AMI admissions, revealing a downward trend in AMI incidence and associated mortality as well as marked weekly and seasonal variations, with AMI admissions peaking in the colder months.
- –
Analysis of the association between AMI admissions and air pollutants revealed a direct and statistically significant association with PM10, a finding with implications for the development of prevention strategies.