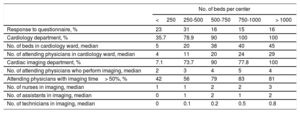
In recent years, cardiac imaging has become increasingly complex and technical while the indications for imaging procedures have been extended. To analyze the current situation, the Working Group on Cardiovascular Imaging of the Spanish Society of Cardiology (SEC), in line with other similar initiatives,1–5 conducted a voluntary online survey of members of the working group to collect information on activity in 2016. The survey was distributed to 86 hospitals in Spain, with a response rate of 61% (89% in public hospitals, with the only autonomous communities not represented being Castile-La Mancha and the Basque Country). The human resources assigned to cardiac imaging in centers at different levels of care are shown in Table 1. The results for activity and echocardiography equipment are detailed in Table 2. The number of studies, their complexity, and the ratio of studies/device increased; there were a greater number of beds in the institution, 38.6% of devices were more than 10 years old, and 89% of centers had digital image storage capability. The studies performed in the echocardiography laboratory were stored on the server and subject to standard reporting in 91% and 73%, respectively. For studies performed outside the laboratory (eg, clinic, emergency room, acute coronary unit), these percentages decreased to 74% and 60%. The echocardiography laboratories had a registry of indications in 26.5% (the most frequent were ventricular function, arrhythmias, and cardiac valve regurgitation), a registry of events in 47%, and internal quality control procedures in 48% (local protocols, 72%; expert review of reports, 65%; analysis of variability, 40%). Of the total number of attending physicians who performed echocardiography, Spanish or European accreditation had been obtained in transthoracic echocardiography by 26.6%, in transesophageal echocardiography by 8.9%, and in congenital diseases by 3.6%.
Human and Organizational Resources for Cardiology and Cardiac Imaging by Hospital Size
| No. of beds per center | |||||
|---|---|---|---|---|---|
| < 250 | 250-500 | 500-750 | 750-1000 | > 1000 | |
| Response to questionnaire, % | 23 | 31 | 16 | 15 | 16 |
| Cardiology department, % | 35.7 | 78.9 | 90 | 100 | 100 |
| No. of beds in cardiology ward, median | 5 | 20 | 38 | 40 | 45 |
| No. of attending physicians in cardiology ward, median | 4 | 11 | 20 | 24 | 29 |
| Cardiac imaging department, % | 7.1 | 73.7 | 90 | 77.8 | 100 |
| No. of attending physicians who perform imaging, median | 2 | 3 | 4 | 5 | 4 |
| Attending physicians with imaging time> 50%, % | 42 | 56 | 79 | 83 | 81 |
| No. of nurses in imaging, median | 1 | 1 | 2 | 2 | 3 |
| No. of assistants in imaging, median | 0 | 1 | 2 | 1 | 2 |
| No. of technicians in imaging, median | 0 | 0.1 | 0.2 | 0.5 | 0.8 |
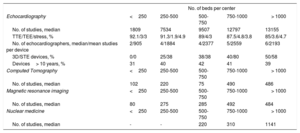
Volume of Activity and Equipment for Each Cardiac Imaging Technique by Hospital Size
| No. of beds per center | |||||
|---|---|---|---|---|---|
| Echocardiography | <250 | 250-500 | 500-750 | 750-1000 | > 1000 |
| No. of studies, median | 1809 | 7534 | 9507 | 12797 | 13155 |
| TTE/TEE/stress, % | 92.1/3/3 | 91.3/1.9/4.9 | 89/4/3 | 87.5/4.8/3.8 | 85/3.6/4.7 |
| No. of echocardiographers, median/mean studies per device | 2/905 | 4/1884 | 4/2377 | 5/2559 | 6/2193 |
| 3D/STE devices, % | 0/0 | 25/38 | 38/38 | 40/80 | 50/58 |
| Devices> 10 years, % | 31 | 40 | 42 | 41 | 39 |
| Computed Tomography | <250 | 250-500 | 500-750 | 750-1000 | > 1000 |
| No. of studies, median | 102 | 220 | 75 | 490 | 486 |
| Magnetic resonance imaging | <250 | 250-500 | 500-750 | 750-1000 | > 1000 |
| No. of studies, median | 80 | 275 | 285 | 492 | 484 |
| Nuclear medicine | <250 | 250-500 | 500-750 | 750-1000 | > 1000 |
| No. of studies, median | - | - | 220 | 310 | 1141 |
3D, 3-dimensional echocardiography; STE, speckle-tracking echocardiography, TEE, transesophageal echocardiography; TTE, transthoracic echocardiography
With regard to nonechocardiographic imaging, Table 2 shows the number of studies performed with each technique according to the complexity of the institution. The main indications for cardiac computed tomography were screening for coronary disease (52%), valve disease study (18%), and study prior to percutaneous aortic valve placement (12%). Overall, 96% of detectors were arrays of 64 or more. Cardiologists participated in the acquisition, analysis, and signing of the report in 56%, 65%, and 56% of cases, respectively. Overall, 30% of the centers had an analysis station in the cardiology department, and the mean time dedicated to this activity was 6.7hours per week. Overall, 83% of the centers measured radiation exposure, but only 25% recorded their results for invasive angiography. In the case of magnetic resonance imaging, the main indications were cardiomyopathies (23%), ventricular function (21%), and viability study (17%). In 73%, the devices used had a 1.5 T field. Cardiologists participated to a greater extent (acquisition, analysis, and signing: 70%, 82%, and 74%, respectively). However, only 7.7% of the centers had an analysis station in the cardiology department, and the mean time dedicated to the activity was similar (7.9hours per week). International accreditation in cardiac study with computed tomography and cardiac magnetic resonance imaging was obtained by 14 institutions and 52% of the cardiologists involved in these techniques. Nuclear medicine studies were performed exclusively in studies with greatest volume. Of the 6653 studies reported, 60% were monophoton emission tomography, 37% were isotope ventriculography (2461 isotope studies to investigate ventricular function in institutions with echocardiography available), and 3% were positron emission tomography studies. The main indications were ischemia (50%) and ventricular function (44%). Cardiologists participated to a lesser extent than in other techniques (acquisition, analysis, and signing: 44%, 33%, and 33%, respectively) and the time dedicated was 8.1hours per week. In 82% of the centers, radiation exposure was measured but only 18% recorded their results for invasive angiography.
With regard to training in cardiac imaging, 65% of the institutions had cardiology residents. The mean duration of training in echocardiography was 7 months, and 1 month was dedicated to each of the other techniques. During their stay in echocardiography, a resident performed a mean of 547 transthoracic studies, 53 transesophageal studies, and 40 stress tests. In addition, 17% of the centers had specialists in cardiology participating in training programs in cardiac imaging after their residency. The mean duration was 12 months and the techniques covered were echocardiography (100%), cardiac magnetic resonance imaging (82%), and cardiac study with computed tomography (64%).
Finally, echocardiography performed by departments other than cardiology was analyzed. This occurred in 80% of the centers. Agreement in the diagnosis was good or acceptable in 52% of the cases. In contrast to the recommendations of the current consensus document,6 the result of this study was only recorded in 44% of the cases.
A registry is an essential element for homogenizing the system and reducing variability in patient care. The present initiative should be the first step for establishing a proper registry and improving knowledge of cardiac imaging in Spain.
.
We would like to thank the team of the P-Investiga platform for their help in conducting this registry.