We present the results of the Spanish Implantable Cardioverter-defibrillator Registry for 2014, as compiled by the Electrophysiology and Arrhythmia Section of the Spanish Society of Cardiology.
MethodsData collection sheets were voluntarily completed by each implantation team and prospectively sent to the Spanish Society of Cardiology.
ResultsThe number of reported implantations was 4911 (82% of the estimated total number of implantations). The implantation rate was 106 per million population while the estimated rate was 128. First implantations comprised 72.2%. Data were obtained from 162 hospitals (8 more than in 2013). Most implantations (82%) were performed in men. The mean patient age was 61.8±13.7 years. Most patients showed severe or moderate-to-severe ventricular dysfunction and were in New York Heart Association functional class II. The most frequent cardiac condition was ischemic heart disease, followed by dilated cardiomyopathy. Implantations for primary prevention indications comprised 58.5%. Electrophysiologists performed 85.6% of the implantations.
ConclusionsThe 2014 Spanish Implantable Cardioverter-defibrillator Registry received information on 82% of the implantations performed in Spain. The number of implantations has increased from previous years and the percentage of implantations for primary prevention indications has increased from the previous year.
Keywords
Implantable cardioverter-defibrillators (ICD) are useful for the primary and secondary prevention of sudden cardiac death. The main indications for ICD implantation have been derived from numerous studies and have been included in the successive clinical management guidelines of patients with ventricular arrhythmia or at risk of sudden cardiac death.1–3 However, the increased use of ICD has raised questions about their effectiveness outside the setting of clinical trials, about the real-world selection of patients for implantation, and about the availability, safety, and cost-effectiveness of this therapy.4 Thus, considering the little information in the medical literature on these aspects and the application of the clinical guidelines to unselected patient populations, health care registries could be extremely useful.
The current study presents the data on ICD implantation reported to the Spanish Implantable Cardioverter-defibrillator Registry in 2014. Most Spanish centers implanting ICD have contributed to the registry. As in the previous official reports on this activity in Spain,5–13 this report has been prepared by the members of the Electrophysiology and Arrhythmia Section of the Spanish Society of Cardiology (SEC, Sociedad Española de Cardiología).
The main aim of the registry is to determine the current implantation situation in Spain, with special emphasis on indications, patients’ clinical characteristics, implantation data, types of devices, programming, and procedural complications.
METHODSThe registry data were obtained using a data collection form, available at the SEC website.14 Each implantation team directly and voluntarily completed this form during or after the procedure with the help of the technical staff of the ICD manufacturer.
A specially appointed technician introduced the information into the database of the Spanish Implantable Cardioverter-defibrillator Registry, with the help of a computer technician of the SEC and a member of the Electrophysiology and Arrhythmia Section. The computer technician and section member also performed data cleaning. The authors of this article analyzed the data and are responsible for this publication.
The census data for the distinct calculations of rates per million population, both national and by autonomous community and province, were obtained from the estimations of the Spanish National Institute of Statistics as of 1 January, 2014.15
To estimate the representativeness of the registry, the proportion of implantations and replacements recorded in the registry was calculated with respect to the total number of implantations and replacements performed in Spain in 2014. This number was based on the data for 2014 reported to the European Medical Technology Industry Association (EUCOMED) by the suppliers of ICD in Spain.16
If the data collection sheet recorded various clinical presentations or arrhythmias in the same patient, only the most serious condition was included in the analysis.
The percentages of each of the variables analyzed were calculated by taking into account the total number of implantations including information on the analysis variable.
Statistical AnalysisNumerical results are expressed as mean±standard deviation or median [interquartile range], according to the distribution of the variable. Continuous quantitative variables were compared using analysis of variance or the Kruskal-Wallis test. Qualitative variables were compared using the chi-square test. The relationships between the number of implantations and the devices implanted per million population and the total number of implantations and the number of implantations for primary prevention in each center were studied using linear regression models.
RESULTSThe response rates to the distinct fields of the data collection sheet ranged from 99.6% for the name of the implanting hospital to 12.6% for QRS width.
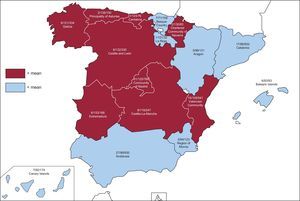
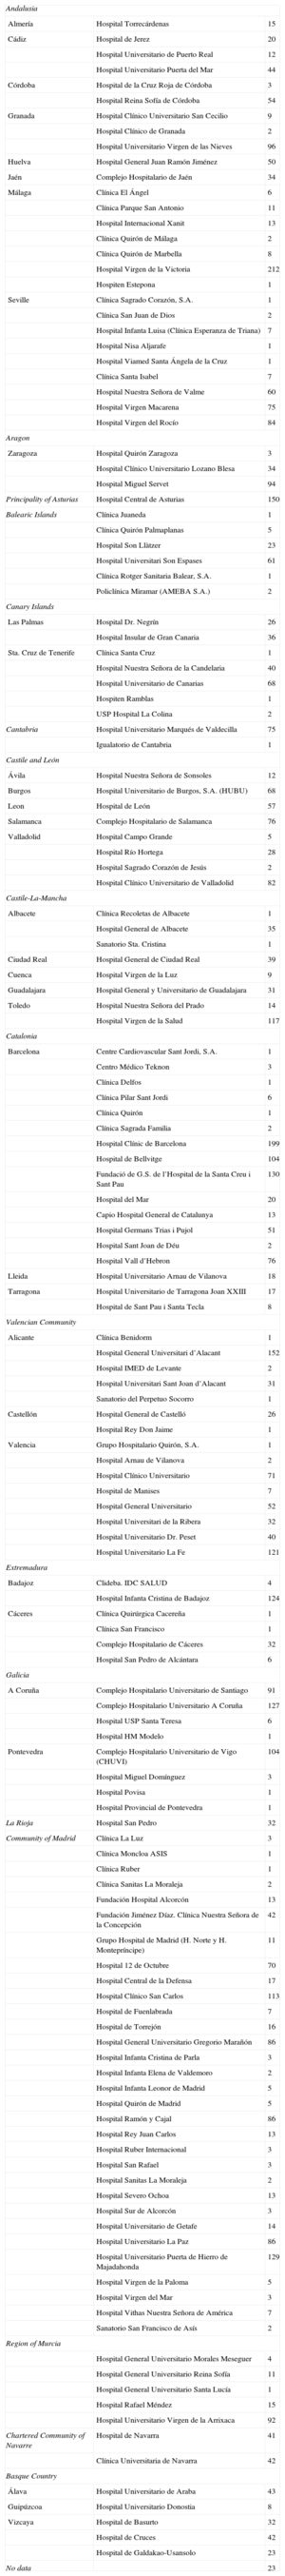
Implanting CentersIn total, 162 hospitals performing ICD implantations reported their data to the registry (154 in 2013). The data from 152 hospitals are shown in Table 1; 10 centers were excluded due to errors in the data collection sheet. As in the previous year, 90 were public centers. The total number of implanting centers, rate per million population, and total number by autonomous community according to the data sent to the registry are shown in Figure 1. During 2014, only 13 centers implanted more than 100 devices; 79, fewer than 10; and 32, only 1.
Implantations by Autonomous Community, Province, and Hospital
| Andalusia | ||
| Almería | Hospital Torrecárdenas | 15 |
| Cádiz | Hospital de Jerez | 20 |
| Hospital Universitario de Puerto Real | 12 | |
| Hospital Universitario Puerta del Mar | 44 | |
| Córdoba | Hospital de la Cruz Roja de Córdoba | 3 |
| Hospital Reina Sofía de Córdoba | 54 | |
| Granada | Hospital Clínico Universitario San Cecilio | 9 |
| Hospital Clínico de Granada | 2 | |
| Hospital Universitario Virgen de las Nieves | 96 | |
| Huelva | Hospital General Juan Ramón Jiménez | 50 |
| Jaén | Complejo Hospitalario de Jaén | 34 |
| Málaga | Clínica El Ángel | 6 |
| Clínica Parque San Antonio | 11 | |
| Hospital Internacional Xanit | 13 | |
| Clínica Quirón de Málaga | 2 | |
| Clínica Quirón de Marbella | 8 | |
| Hospital Virgen de la Victoria | 212 | |
| Hospiten Estepona | 1 | |
| Seville | Clínica Sagrado Corazón, S.A. | 1 |
| Clínica San Juan de Dios | 2 | |
| Hospital Infanta Luisa (Clínica Esperanza de Triana) | 7 | |
| Hospital Nisa Aljarafe | 1 | |
| Hospital Viamed Santa Ángela de la Cruz | 1 | |
| Clínica Santa Isabel | 7 | |
| Hospital Nuestra Señora de Valme | 60 | |
| Hospital Virgen Macarena | 75 | |
| Hospital Virgen del Rocío | 84 | |
| Aragon | ||
| Zaragoza | Hospital Quirón Zaragoza | 3 |
| Hospital Clínico Universitario Lozano Blesa | 34 | |
| Hospital Miguel Servet | 94 | |
| Principality of Asturias | Hospital Central de Asturias | 150 |
| Balearic Islands | Clínica Juaneda | 1 |
| Clínica Quirón Palmaplanas | 5 | |
| Hospital Son Llàtzer | 23 | |
| Hospital Universitari Son Espases | 61 | |
| Clínica Rotger Sanitaria Balear, S.A. | 1 | |
| Policlínica Miramar (AMEBA S.A.) | 2 | |
| Canary Islands | ||
| Las Palmas | Hospital Dr. Negrín | 26 |
| Hospital Insular de Gran Canaria | 36 | |
| Sta. Cruz de Tenerife | Clínica Santa Cruz | 1 |
| Hospital Nuestra Señora de la Candelaria | 40 | |
| Hospital Universitario de Canarias | 68 | |
| Hospiten Ramblas | 1 | |
| USP Hospital La Colina | 2 | |
| Cantabria | Hospital Universitario Marqués de Valdecilla | 75 |
| Igualatorio de Cantabria | 1 | |
| Castile and León | ||
| Ávila | Hospital Nuestra Señora de Sonsoles | 12 |
| Burgos | Hospital Universitario de Burgos, S.A. (HUBU) | 68 |
| Leon | Hospital de León | 57 |
| Salamanca | Complejo Hospitalario de Salamanca | 76 |
| Valladolid | Hospital Campo Grande | 5 |
| Hospital Río Hortega | 28 | |
| Hospital Sagrado Corazón de Jesús | 2 | |
| Hospital Clínico Universitario de Valladolid | 82 | |
| Castile-La-Mancha | ||
| Albacete | Clínica Recoletas de Albacete | 1 |
| Hospital General de Albacete | 35 | |
| Sanatorio Sta. Cristina | 1 | |
| Ciudad Real | Hospital General de Ciudad Real | 39 |
| Cuenca | Hospital Virgen de la Luz | 9 |
| Guadalajara | Hospital General y Universitario de Guadalajara | 31 |
| Toledo | Hospital Nuestra Señora del Prado | 14 |
| Hospital Virgen de la Salud | 117 | |
| Catalonia | ||
| Barcelona | Centre Cardiovascular Sant Jordi, S.A. | 1 |
| Centro Médico Teknon | 3 | |
| Clínica Delfos | 1 | |
| Clínica Pilar Sant Jordi | 6 | |
| Clínica Quirón | 1 | |
| Clínica Sagrada Familia | 2 | |
| Hospital Clínic de Barcelona | 199 | |
| Hospital de Bellvitge | 104 | |
| Fundació de G.S. de l’Hospital de la Santa Creu i Sant Pau | 130 | |
| Hospital del Mar | 20 | |
| Capio Hospital General de Catalunya | 13 | |
| Hospital Germans Trias i Pujol | 51 | |
| Hospital Sant Joan de Déu | 2 | |
| Hospital Vall d’Hebron | 76 | |
| Lleida | Hospital Universitario Arnau de Vilanova | 18 |
| Tarragona | Hospital Universitario de Tarragona Joan XXIII | 17 |
| Hospital de Sant Pau i Santa Tecla | 8 | |
| Valencian Community | ||
| Alicante | Clínica Benidorm | 1 |
| Hospital General Universitari d’Alacant | 152 | |
| Hospital IMED de Levante | 2 | |
| Hospital Universitari Sant Joan d’Alacant | 31 | |
| Sanatorio del Perpetuo Socorro | 1 | |
| Castellón | Hospital General de Castelló | 26 |
| Hospital Rey Don Jaime | 1 | |
| Valencia | Grupo Hospitalario Quirón, S.A. | 1 |
| Hospital Arnau de Vilanova | 2 | |
| Hospital Clínico Universitario | 71 | |
| Hospital de Manises | 7 | |
| Hospital General Universitario | 52 | |
| Hospital Universitari de la Ribera | 32 | |
| Hospital Universitario Dr. Peset | 40 | |
| Hospital Universitario La Fe | 121 | |
| Extremadura | ||
| Badajoz | Clideba. IDC SALUD | 4 |
| Hospital Infanta Cristina de Badajoz | 124 | |
| Cáceres | Clínica Quirúrgica Cacereña | 1 |
| Clínica San Francisco | 1 | |
| Complejo Hospitalario de Cáceres | 32 | |
| Hospital San Pedro de Alcántara | 6 | |
| Galicia | ||
| A Coruña | Complejo Hospitalario Universitario de Santiago | 91 |
| Complejo Hospitalario Universitario A Coruña | 127 | |
| Hospital USP Santa Teresa | 6 | |
| Hospital HM Modelo | 1 | |
| Pontevedra | Complejo Hospitalario Universitario de Vigo (CHUVI) | 104 |
| Hospital Miguel Domínguez | 3 | |
| Hospital Povisa | 1 | |
| Hospital Provincial de Pontevedra | 1 | |
| La Rioja | Hospital San Pedro | 32 |
| Community of Madrid | Clínica La Luz | 3 |
| Clínica Moncloa ASIS | 1 | |
| Clínica Ruber | 1 | |
| Clínica Sanitas La Moraleja | 2 | |
| Fundación Hospital Alcorcón | 13 | |
| Fundación Jiménez Díaz. Clínica Nuestra Señora de la Concepción | 42 | |
| Grupo Hospital de Madrid (H. Norte y H. Montepríncipe) | 11 | |
| Hospital 12 de Octubre | 70 | |
| Hospital Central de la Defensa | 17 | |
| Hospital Clínico San Carlos | 113 | |
| Hospital de Fuenlabrada | 7 | |
| Hospital de Torrejón | 16 | |
| Hospital General Universitario Gregorio Marañón | 86 | |
| Hospital Infanta Cristina de Parla | 3 | |
| Hospital Infanta Elena de Valdemoro | 2 | |
| Hospital Infanta Leonor de Madrid | 5 | |
| Hospital Quirón de Madrid | 5 | |
| Hospital Ramón y Cajal | 86 | |
| Hospital Rey Juan Carlos | 13 | |
| Hospital Ruber Internacional | 3 | |
| Hospital San Rafael | 3 | |
| Hospital Sanitas La Moraleja | 2 | |
| Hospital Severo Ochoa | 13 | |
| Hospital Sur de Alcorcón | 3 | |
| Hospital Universitario de Getafe | 14 | |
| Hospital Universitario La Paz | 86 | |
| Hospital Universitario Puerta de Hierro de Majadahonda | 129 | |
| Hospital Virgen de la Paloma | 5 | |
| Hospital Virgen del Mar | 3 | |
| Hospital Vithas Nuestra Señora de América | 7 | |
| Sanatorio San Francisco de Asís | 2 | |
| Region of Murcia | ||
| Hospital General Universitario Morales Meseguer | 4 | |
| Hospital General Universitario Reina Sofía | 11 | |
| Hospital General Universitario Santa Lucía | 1 | |
| Hospital Rafael Méndez | 15 | |
| Hospital Universitario Virgen de la Arrixaca | 92 | |
| Chartered Community of Navarre | Hospital de Navarra | 41 |
| Clínica Universitaria de Navarra | 42 | |
| Basque Country | ||
| Álava | Hospital Universitario de Araba | 43 |
| Guipúzcoa | Hospital Universitario Donostia | 8 |
| Vizcaya | Hospital de Basurto | 32 |
| Hospital de Cruces | 42 | |
| Hospital de Galdakao-Usansolo | 23 | |
| No data | 23 | |

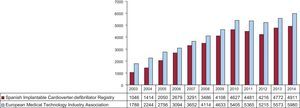
The total number of implantations (first implantations and replacements) in 2014 was 4899, more than in 2013 (total number, 4722). Because the EUCOMED data16 showed a total number of devices of 5980, this figure represents 82% of the total. The total number of implantations reported to the registry and those estimated by the EUCOMED in the last 12 years are shown in Figure 2.

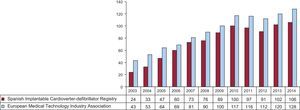
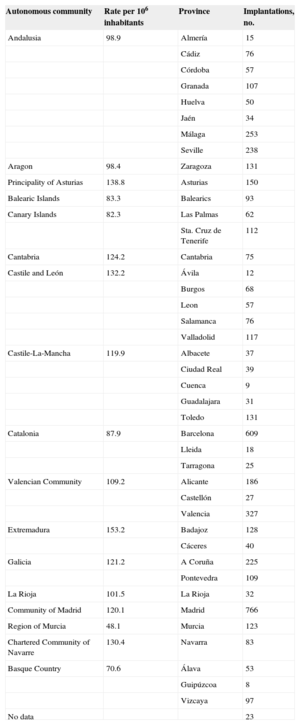
The overall rate of recorded implantations was 106 per million population; according to the EUCOMED data, the rate was 128 per million population. The change in the implantation rate per million population during the last 12 years according to the registry and EUCOMED data is shown in Figure 3. Implantations reported per implanting center are shown in Table 1; the number of implantations performed in each province and the corresponding rate per million population by autonomous community are shown in Table 2.

Implantations by Autonomous Community and Province
| Autonomous community | Rate per 106 inhabitants | Province | Implantations, no. |
|---|---|---|---|
| Andalusia | 98.9 | Almería | 15 |
| Cádiz | 76 | ||
| Córdoba | 57 | ||
| Granada | 107 | ||
| Huelva | 50 | ||
| Jaén | 34 | ||
| Málaga | 253 | ||
| Seville | 238 | ||
| Aragon | 98.4 | Zaragoza | 131 |
| Principality of Asturias | 138.8 | Asturias | 150 |
| Balearic Islands | 83.3 | Balearics | 93 |
| Canary Islands | 82.3 | Las Palmas | 62 |
| Sta. Cruz de Tenerife | 112 | ||
| Cantabria | 124.2 | Cantabria | 75 |
| Castile and León | 132.2 | Ávila | 12 |
| Burgos | 68 | ||
| Leon | 57 | ||
| Salamanca | 76 | ||
| Valladolid | 117 | ||
| Castile-La-Mancha | 119.9 | Albacete | 37 |
| Ciudad Real | 39 | ||
| Cuenca | 9 | ||
| Guadalajara | 31 | ||
| Toledo | 131 | ||
| Catalonia | 87.9 | Barcelona | 609 |
| Lleida | 18 | ||
| Tarragona | 25 | ||
| Valencian Community | 109.2 | Alicante | 186 |
| Castellón | 27 | ||
| Valencia | 327 | ||
| Extremadura | 153.2 | Badajoz | 128 |
| Cáceres | 40 | ||
| Galicia | 121.2 | A Coruña | 225 |
| Pontevedra | 109 | ||
| La Rioja | 101.5 | La Rioja | 32 |
| Community of Madrid | 120.1 | Madrid | 766 |
| Region of Murcia | 48.1 | Murcia | 123 |
| Chartered Community of Navarre | 130.4 | Navarra | 83 |
| Basque Country | 70.6 | Álava | 53 |
| Guipúzcoa | 8 | ||
| Vizcaya | 97 | ||
| No data | 23 |
The implanting hospital was recorded in 99% of cases. Most implantations, 4506 (92.4%) were performed in public health care centers.
First Implantations vs ReplacementsThis information was available in 4741 forms sent to the SEC (96.8%). There were 3446 first implantations, representing 72.6% of the total (68.8% in 2013; 69.4% in 2012; 70.2% in 2011; and 73.8% in 2010). The rate of first implantations per million population was 79.0 in 2014 (63.8 in 2013; and 64 in 2012).
Age and SexThe mean age±standard deviation [interval] of patients receiving an ICD implantation or replacement was 61.8±13.7 [7-94] years. In first implantation patients, the age was 60.9±13.4 years. Most patients were men, who represented 82.00% of all patients and 81.57% of first implantation patients.
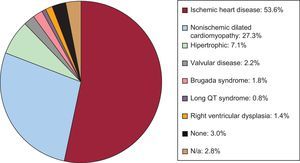
Underlying Heart Disease, Left Ventricular Ejection Fraction, Functional Class, and Baseline RhythmThe most frequent underlying cardiac condition in first implantation patients was ischemic heart disease (53.6%), followed by dilated cardiomyopathy (27.3%), hypertrophic (7.1%), the group of primary conduction abnormalities (Brugada syndrome, idiopathic ventricular fibrillation, and long QT syndrome) (2.6%), and, at lower percentages, valve diseases and arrhythmogenic dysplasias (Figure 4).
. Sole diagnosis.")
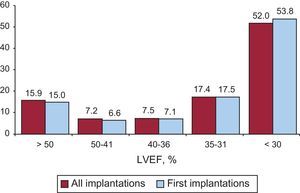
Left ventricular fraction was < 30% in 53.8% of first implantation patients, 30% to 40% in 24.6%, 41% to 50% in 6.6%, and > 50% in 15%. Patients who underwent ICD replacement showed a similar distribution (Figure 5). These data were recorded in 80.7% of the data collection sheets of the registry.
. LVEF, left ventricular ejection fraction.")
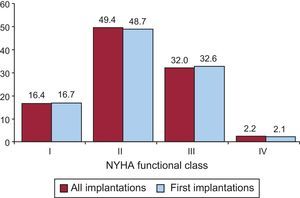
With respect to the New York Heart Association (NYHA) functional class, most patients were in NYHA II (48.7%), followed by NYHA III (32.6%), NYHA I (16.7%), and NYHA IV (2.1%). For this parameter, the distribution was also similar between total implantations and first implantations (Figure 6), and these data were reported in 58.6% of the data collection sheets.

The baseline rhythm, reported in 85.3% of the patients, was largely sinusal (79.3%), followed by atrial fibrillation (16.5%) and pacemaker rhythm (3.9%); the remaining patients had other rhythms (atrial flutter and other arrhythmias).
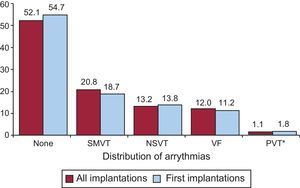
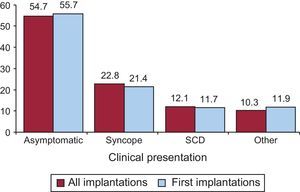
Clinical Arrhythmia Prompting Device Implantation, Its Form of Presentation, and the Arrhythmia Induced in the Electrophysiological StudyThese data were contained in 80.7% of the registry forms. For first implantations, most patients had no documented clinical arrhythmias (54.7%), followed by those with sustained monomorphic ventricular tachycardia, nonsustained ventricular tachycardia, and ventricular fibrillation (18.7%, 13.8%, and 11.2%, respectively). In total, patients with no documented clinical arrhythmia comprised 54.7% (Figure 7). The differences in the type of arrhythmia between the first implantation group and the total were significant for patients with polymorphic ventricular tachycardia (P<.001). There were no significant differences in the other categories. The most frequent clinical presentation in both the total implantation group and the first implantation patients (62.2% and 68.9% of completed responses) was asymptomatic, followed by syncope, cardiac arrest, and “other symptoms” (Figure 8).
. NSVT, nonsustained ventricular tachycardia; PVT, polymorphic ventricular tachycardia; SMVT, sustained monomorphic ventricular tachycardia; VF, ventricular fibrillation. *P<.001.")
. SCD, sudden cardiac death.")
Data on electrophysiological studies were available for 1525 first implantation patients (44.3%). Such studies were performed in only 244 patients (13.8%). Sustained monomorphic ventricular tachycardia was the most common induced arrhythmia (43.0%), followed by ventricular fibrillation (17.6%) and, to a lesser extent, nonsustained ventricular tachycardia (11.5%) and others (3.3%). No arrhythmia was induced in 24.5% of the electrophysiological studies. Most of these studies were performed in patients with ischemic heart disease or dilated cardiomyopathy.
Clinical HistoryData on the clinical history of patients have only been available since 2011 because such data were not previously recorded.
Responses to questions on clinical history were obtained for between 66.8% and 82.1% of first implantation patients, with the following findings: hypertension, 58.8%; hypercholesterolemia, 51.2%; smoking, 36.9%; diabetes mellitus, 31.8%; history of atrial fibrillation, 25.0%; kidney failure, 13.6%; history of sudden cardiac death, 7.3%; and stroke, 5.0%.
The QRS width was recorded in 37.1% of the forms (mean, 122.6ms±37ms). In 33.4% of the patients, the recorded width was > 140ms. Of these patients, 83.3% of the first implantation patients and 83.7% of the total had a defibrillator-resynchronization device (ICD-CRT [cardiac resynchronization therapy]) device.
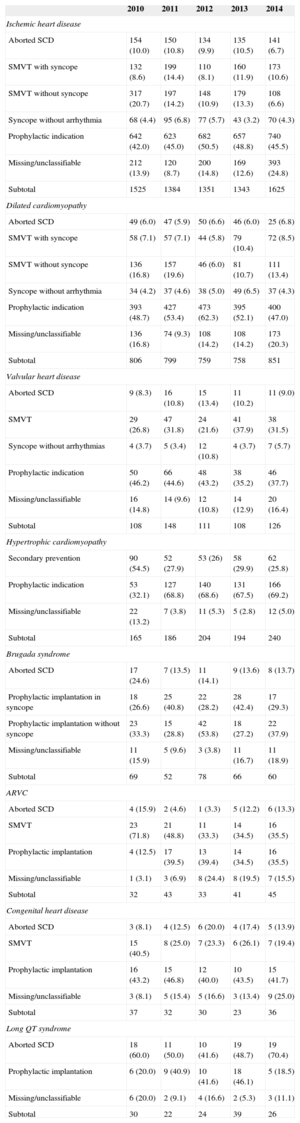
IndicationsThe changes in the type of heart disease and presentation in first implantation patients from 2010 to 2014 are shown in Table 3. Data on this parameter were recorded in 85% of the registry collection sheets. For ischemic heart disease, the most frequent indication was prophylactic prevention (45.5%), representing a slight decrease from the previous year (48.8%). For dilated cardiomyopathy, the main indication was also prophylactic (47% vs 52.1% in 2013 and 62.3% in 2012). For less common heart diseases, the most frequent indication was primary prevention of hypertrophic cardiomyopathy, valve diseases, congenital diseases, and Brugada syndrome. For long QT syndrome, secondary prevention was the most common indication.
Number of First Implantations According to the Type of Heart Disease, Type of Clinical Arrhythmia, and Form of Presentation From 2009 to 2014
| 2010 | 2011 | 2012 | 2013 | 2014 | |
|---|---|---|---|---|---|
| Ischemic heart disease | |||||
| Aborted SCD | 154 (10.0) | 150 (10.8) | 134 (9.9) | 135 (10.5) | 141 (6.7) |
| SMVT with syncope | 132 (8.6) | 199 (14.4) | 110 (8.1) | 160 (11.9) | 173 (10.6) |
| SMVT without syncope | 317 (20.7) | 197 (14.2) | 148 (10.9) | 179 (13.3) | 108 (6.6) |
| Syncope without arrhythmia | 68 (4.4) | 95 (6.8) | 77 (5.7) | 43 (3.2) | 70 (4.3) |
| Prophylactic indication | 642 (42.0) | 623 (45.0) | 682 (50.5) | 657 (48.8) | 740 (45.5) |
| Missing/unclassifiable | 212 (13.9) | 120 (8.7) | 200 (14.8) | 169 (12.6) | 393 (24.8) |
| Subtotal | 1525 | 1384 | 1351 | 1343 | 1625 |
| Dilated cardiomyopathy | |||||
| Aborted SCD | 49 (6.0) | 47 (5.9) | 50 (6.6) | 46 (6.0) | 25 (6.8) |
| SMVT with syncope | 58 (7.1) | 57 (7.1) | 44 (5.8) | 79 (10.4) | 72 (8.5) |
| SMVT without syncope | 136 (16.8) | 157 (19.6) | 46 (6.0) | 81 (10.7) | 111 (13.4) |
| Syncope without arrhythmia | 34 (4.2) | 37 (4.6) | 38 (5.0) | 49 (6.5) | 37 (4.3) |
| Prophylactic indication | 393 (48.7) | 427 (53.4) | 473 (62.3) | 395 (52.1) | 400 (47.0) |
| Missing/unclassifiable | 136 (16.8) | 74 (9.3) | 108 (14.2) | 108 (14.2) | 173 (20.3) |
| Subtotal | 806 | 799 | 759 | 758 | 851 |
| Valvular heart disease | |||||
| Aborted SCD | 9 (8.3) | 16 (10.8) | 15 (13.4) | 11 (10.2) | 11 (9.0) |
| SMVT | 29 (26.8) | 47 (31.8) | 24 (21.6) | 41 (37.9) | 38 (31.5) |
| Syncope without arrhythmias | 4 (3.7) | 5 (3.4) | 12 (10.8) | 4 (3.7) | 7 (5.7) |
| Prophylactic indication | 50 (46.2) | 66 (44.6) | 48 (43.2) | 38 (35.2) | 46 (37.7) |
| Missing/unclassifiable | 16 (14.8) | 14 (9.6) | 12 (10.8) | 14 (12.9) | 20 (16.4) |
| Subtotal | 108 | 148 | 111 | 108 | 126 |
| Hypertrophic cardiomyopathy | |||||
| Secondary prevention | 90 (54.5) | 52 (27.9) | 53 (26) | 58 (29.9) | 62 (25.8) |
| Prophylactic indication | 53 (32.1) | 127 (68.8) | 140 (68.6) | 131 (67.5) | 166 (69.2) |
| Missing/unclassifiable | 22 (13.2) | 7 (3.8) | 11 (5.3) | 5 (2.8) | 12 (5.0) |
| Subtotal | 165 | 186 | 204 | 194 | 240 |
| Brugada syndrome | |||||
| Aborted SCD | 17 (24.6) | 7 (13.5) | 11 (14.1) | 9 (13.6) | 8 (13.7) |
| Prophylactic implantation in syncope | 18 (26.6) | 25 (40.8) | 22 (28.2) | 28 (42.4) | 17 (29.3) |
| Prophylactic implantation without syncope | 23 (33.3) | 15 (28.8) | 42 (53.8) | 18 (27.2) | 22 (37.9) |
| Missing/unclassifiable | 11 (15.9) | 5 (9.6) | 3 (3.8) | 11 (16.7) | 11 (18.9) |
| Subtotal | 69 | 52 | 78 | 66 | 60 |
| ARVC | |||||
| Aborted SCD | 4 (15.9) | 2 (4.6) | 1 (3.3) | 5 (12.2) | 6 (13.3) |
| SMVT | 23 (71.8) | 21 (48.8) | 11 (33.3) | 14 (34.5) | 16 (35.5) |
| Prophylactic implantation | 4 (12.5) | 17 (39.5) | 13 (39.4) | 14 (34.5) | 16 (35.5) |
| Missing/unclassifiable | 1 (3.1) | 3 (6.9) | 8 (24.4) | 8 (19.5) | 7 (15.5) |
| Subtotal | 32 | 43 | 33 | 41 | 45 |
| Congenital heart disease | |||||
| Aborted SCD | 3 (8.1) | 4 (12.5) | 6 (20.0) | 4 (17.4) | 5 (13.9) |
| SMVT | 15 (40.5) | 8 (25.0) | 7 (23.3) | 6 (26.1) | 7 (19.4) |
| Prophylactic implantation | 16 (43.2) | 15 (46.8) | 12 (40.0) | 10 (43.5) | 15 (41.7) |
| Missing/unclassifiable | 3 (8.1) | 5 (15.4) | 5 (16.6) | 3 (13.4) | 9 (25.0) |
| Subtotal | 37 | 32 | 30 | 23 | 36 |
| Long QT syndrome | |||||
| Aborted SCD | 18 (60.0) | 11 (50.0) | 10 (41.6) | 19 (48.7) | 19 (70.4) |
| Prophylactic implantation | 6 (20.0) | 9 (40.9) | 10 (41.6) | 18 (46.1) | 5 (18.5) |
| Missing/unclassifiable | 6 (20.0) | 2 (9.1) | 4 (16.6) | 2 (5.3) | 3 (11.1) |
| Subtotal | 30 | 22 | 24 | 39 | 26 |
ARVC, arrhythmogenic right ventricular cardiomyopathy; SCD, sudden cardiac death; SMVT, sustained monomorphic ventricular tachycardia.
Data are expressed as No. (%).
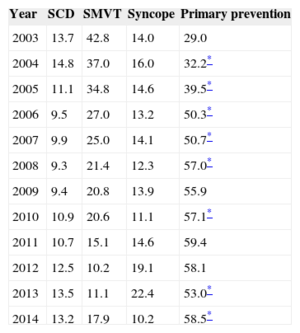
The implantation indication was reported in 65% of the records. Most first implantations were indicated for primary prevention (58.5%), reversing the decreasing trend of the previous 2 years. This variability has been growing, and was statistically significant until 2008, in 2009 and 2010, and in 2013 and 2014 (P<.02) (Table 4).
Changes in the Main Indications for Implantable Cardioverter-defibrillators (First Implantations, 2003-2014)
| Year | SCD | SMVT | Syncope | Primary prevention |
|---|---|---|---|---|
| 2003 | 13.7 | 42.8 | 14.0 | 29.0 |
| 2004 | 14.8 | 37.0 | 16.0 | 32.2* |
| 2005 | 11.1 | 34.8 | 14.6 | 39.5* |
| 2006 | 9.5 | 27.0 | 13.2 | 50.3* |
| 2007 | 9.9 | 25.0 | 14.1 | 50.7* |
| 2008 | 9.3 | 21.4 | 12.3 | 57.0* |
| 2009 | 9.4 | 20.8 | 13.9 | 55.9 |
| 2010 | 10.9 | 20.6 | 11.1 | 57.1* |
| 2011 | 10.7 | 15.1 | 14.6 | 59.4 |
| 2012 | 12.5 | 10.2 | 19.1 | 58.1 |
| 2013 | 13.5 | 11.1 | 22.4 | 53.0* |
| 2014 | 13.2 | 17.9 | 10.2 | 58.5* |
SCD, sudden cardiac death; SMVT, sustained monomorphic ventricular tachycardia.
There was an 87.4% response rate to these questions. In 83.4%, the main implantation location was the electrophysiology laboratory (79.8% in 2013, 81.4% in 2012, and 76.4% in 2011), followed by the operating room (15.0%). Electrophysiologists performed 81.7% of implantations (80.7% in 2013; 81.0% in 2012; and 78.4% in 2011); surgeons, 11.0% (13.8% in 2013; 14.0% in 2012; and 15.5% in 2011); both specialist types, 4.6%; and other specialists and intensivists, 1.4% and 1.3%, respectively.
Generator Placement SiteInformation on the placement of first implantations was provided in 2906 forms (87.8%). Placement was subcutaneous in 95.2% of patients and subpectoral in the remaining 4.8%. The figures were also 95.2% and 4.8% for all devices implanted, respectively.
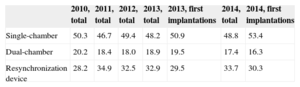
Device TypeThis information was available in 94.9% of the records and is summarized in Table 5. Single-chamber devices comprised 48.8% of implanted ICD (48.2% in 2013 and 49.4% in 2012), dual-chamber devices comprised 17.4% (18.9% in 2013 and 18.0% in 2012), and ICD-CRT devices comprised 33.7% (32.9% in 2013 and 32.5% in 2012).
Distribution (%) of the Types of Devices Implanted
| 2010, total | 2011, total | 2012, total | 2013, total | 2013, first implantations | 2014, total | 2014, first implantations | |
|---|---|---|---|---|---|---|---|
| Single-chamber | 50.3 | 46.7 | 49.4 | 48.2 | 50.9 | 48.8 | 53.4 |
| Dual-chamber | 20.2 | 18.4 | 18.0 | 18.9 | 19.5 | 17.4 | 16.3 |
| Resynchronization device | 28.2 | 34.9 | 32.5 | 32.9 | 29.5 | 33.7 | 30.3 |
In patients with ischemic heart disease, 76.8% of implants (74.8% in 2013 and 72.3% in 2012) were single- or double-chamber devices and 23.1% (25.5% in 2013 and 27.7% in 2012) were ICD-CRT devices. In patients with dilated cardiomyopathy, ICD-CRT devices comprised 53.7% (51.7% in 2013 and 56.5% in 2012).
Reasons for Device Replacement, Need for Lead Replacement, and Use of Additional LeadsOf the 1282 replacements, information was available on 976 (76.1%). The most frequent reason for replacement was battery depletion (83.5%); complications motivated 7.9% (same as in 2013) and a change of indication prompted 8.6%. Of the latter, 84 replacements or 9.62% (11.6% in 2013) were required before 6 months.
Information was available on the status of the leads in 70.8% of the replacements; 9.3% were malfunctioning (85 records) and they were extracted in 46% of the patients reporting this problem.
Device ProgrammingInformation on this parameter was provided in 73.5% of records. The most widely used programming was VVI (54.1%), followed by DDD (31.6%), VVIR (6.4%), DDDR (5.1%), and other modes, largely algorithms to prevent ventricular pacing (2.3%).
Induction of ventricular fibrillation was tested in 128 patients, 2.9% (5.1% in 2013 and 6.7% in 2012) of the 4385 records providing this information. The mean threshold was 19.7±6.8 (20.4±6.5 in 2013 and 20.5±7.1 in 2012) and the mean number of shocks was 1.3.
ComplicationsWith a response rate of 83.6%, 27 complications were reported: 6 coronary sinus dissections, 5 pneumothoraces, 3 tamponades, 2 deaths, and 11 unspecified complications. The mortality rate was 0.05%, the same as in the previous year (0.05%).
DISCUSSIONThe 2014 data of the Spanish Implantable Cardioverter-defibrillator Registry continue to adequately reflect the implantation situation in Spain. The registry information is pertinent, particularly the number of implants, type of implant, indications, and patients’ clinical characteristics.
Comparison With Registries of Previous YearsThe Spanish Implantable Cardioverter-defibrillator Registry was first published in 2005 with the results of 2002 to 2004.4 The number of implanted ICD increased each year until 2010,5–10 with 2011 and 2012 then showing a decreased total number of implantations, in both the registry11,12 and EUCOMED data. In 2013, the number of implantations rose again, exceeding the figures of the 2010 registry, and the number of implanted devices has increased further in 2014. A continual increase was also seen in Europe, in both the number of ICD and the number of ICD-CRTs.16
In contrast to 2013,13 when a decrease was seen in the percentage of implantations for primary indications, the current registry found an increase (58.3% vs 53.0%), with the percentage now exceeding that of 2012 (58.1%).12
There was a slight increment in the percentage of ICD-CRT implantations (33.7% vs 32.9% in 2013 and 32.5% in 2012). The percentage of single-chamber ICD stabilized (48.8% vs 48.2% in 2013 and 49.4% in 2012). There were practically no variations in the use of dual-chamber ICD (17.4% vs 18.9% in 2013 and 18.0% in 2012). The resynchronization rate has slightly increased in recent years, and no major changes are expected, unless the resynchronization indications are updated.
The most frequent indication in 2014 continued to be ischemic heart disease (53.6%), followed by dilated cardiomyopathy (27.3%). As in previous years,13 more than half of the implantations in patients with dilated cardiomyopathy were of ICD-CRT devices (53.7%). The incidence was lower in patients with ischemic heart disease (23.1%).
The progressive increase in the number of ICD implantations stopped in 2011 and 2012. The 2013 results showed somewhat of a recovery with the total number of implantations slightly surpassing the rate per million population of 2010 (102 vs 100).13 This increase was confirmed by the data for 2014, with an implantation rate of 106 in our registry.
No recent studies have modified the ICD implantation indications. In 2002, the Multicenter Automatic Defibrillator Implantation Trial II17 study was published, followed by the Comparison of Medical Therapy, Pacing and Defibrillation in Heart Failure18 in 2005 and the Sudden Cardiac Death in Heart Failure Trial trial19 in 2006, which established the current indications in primary prevention and cardiac resynchronization and triggered a progressive increase in the number of implantations during that decade. The indications for ICD and CRT implantation are well supported in clinical practice guidelines.20–25 However, the implantation rate per million population does not correspond with that expected from the clinical evidence, both in Spain and in other European countries,26 a tendency that has become consolidated with time in these countries.
As in previous registries, the 2014 registry represents 82% of the implantations reported to the EUCOMED (85% in 2013). Most of the hospitals implanting ICD provided the registry with data but 100% participation of the implanting centers remains to be reached. In addition, some data are lost while being sent and processed. All of these factors can explain the differences from the EUCOMED data.
The number of implanting centers slightly increased from 2013. One hospital reported more than 200 implantations; 11 hospitals (14 in 2013 and 8 in 2011) reported more than 100 implantations, and 68 centers, mainly private, reported less than 10 implantations. Some studies have shown an inverse relationship between the implantation volume and the number of complications.27
There were no changes from previous registries in the epidemiological characteristics of the patients. Patients with severe ventricular dysfunction and in NYHA II and III continue to predominate. The growing tendency for implantations to be performed in the electrophysiology laboratory continues (83.4% vs 79.8% in 2013 and 81.4% in 2012), as well as those performed by electrophysiologists (81.7% vs 80.7% in 2013 and 81% in 2012).
Differences Among Autonomous CommunitiesDifferences among autonomous communities continue to be evident. The implantation rate was 106 per million population and 128 according to the EUCOMED data; both databases showed an increase from 2012 (102 and 120). Several autonomous communities showed higher rates than the average: Extremadura (153 implantations per million), Principality of Asturias (138), Castile and León (132), the Chartered Community of Navarre (130), Galicia (121), Cantabria (124), Community of Madrid (120), Castile-La-Mancha (119), and the Valencian Community (109). The following were below the average: Andalusia (99), Aragon (98), Catalonia (88), the Region of Murcia (84), the Balearic Islands (83), the Canary Islands (82), and the Basque Country (71). Although the difference between communities with the highest and lowest rates of implantations is currently more than double (153 vs 71), it is lower than in the previous registry (186 vs 71). The number of implantations markedly increased in the Community of Madrid and in Castile-La-Mancha and Castile and León. There was a decrease in the Principality of Asturias and slight decreases in Extremadura, the Chartered Community of Navarre, the Basque Country, and the Valencian Community.
The 2014 data confirm the general increase in Spanish implantation activity seen in the previous registry, which was more acute in the communities with rates below the average. There was no association between the gross domestic product of the community and the number of implantations. Curiously, most high-income communities incomes were below the mean. The communities above the mean are the least populated, except for the Community of Madrid and the Valencian Community. There was also no relationship between the incidence of ischemic heart disease and heart failure in the various communities. There are other possible explanations for these differences, such as the health care organization of each community, the number of arrhythmia units, and the distribution of the referral hospitals.
Comparison With Other CountriesIncluding ICD and ICD-CRT, the implantation rate in the countries participating in the EUCOMED was 302 per million population (289 in 2013). Germany, with 555 devices per million population, is still the country with the highest number of implantations. Spain (126 implantations per million) was the country with the lowest number of implantations. Above the average are the Netherlands (377 implantations per million), Italy (394), Denmark (313), and the Czech Republic (358). Below the average are Poland (296), Austria (278), Ireland (242), Belgium (235), Sweden (226), Norway (221), France (208), Switzerland (226), Finland (215), the United Kingdom (195), Portugal (148), Greece (144), and Spain (126). The difference in the implantation rate in Spain from the European mean continues to grow (126 vs 302 in 2014 and 120 vs 289 in 2013). The difference between Spain and the second-last country persists (126 vs 144).
The ICD implantation rate was 183 per million population in 2013 (176 in 2013). Germany (340 implantations per million population) had the highest number of implantations, whereas Spain (84) had the lowest.
The ICD-CRT implantation rate was 119 per million population (113 in 2013). Germany (215 implantations per million population) continued to be first, whereas Spain (44) had the lowest implantation rate.
The proportion of ICD-CRT with respect to the total varies from 29% in Ireland and Poland to 45% in the Czech Republic and United Kingdom. The European average is 39%. Above the average are Austria, France, Switzerland, the United Kingdom, Italy, and the Czech Republic, whereas Ireland and Poland are below 30%. Spain has a proportion of 35%.
These countries had the same regional differences28,29 seen in the Spanish registry, for unknown reasons. One possible explanation is the number of available arrhythmia units, but that does not explain the relationship, at least in Spain, because communities with the highest number of available units had lower implantation rates. Other explanations, such as per capita income, also fail to show a correlation, with countries such as Ireland, the Czech Republic, and Poland showing much greater implantation rates than Spain. The prevalence of cardiovascular diseases, access to the health care system and its organization, and the degree of acceptance of and adherence to the clinical practice guidelines could be related to the rate and variability of implantations in Spain.
LimitationsThe registry included 82% of implantations performed in Spain according to the EUCOMED data. This figure is lower than that of the previous year (85.6%) but higher than that of 2012 (80.8%). The percentage has decreased from 2007, when the representativeness was 90%. Nonetheless, the number of registered implantations continues to accurately reflect the situation in Spain and the number of participating centers has remained practically unchanged in the last 2 years.
The true number of implantations in some hospitals differs from that reported to the registry, given that the registry only includes the data collection sheets received. Because data can now be sent in various ways, some sheets were not received or correctly registered. Indeed, 2015 will be a year of transition as the registry data will be collected in 2 ways, on paper and via the Internet. From 2016, all data will be collected via the website, which should improve the results and minimize the differences between the data obtained and those provided by the EUCOMED.
There is excessive variability in the percentage of responses to the various questions in the ICD registry sheet, ranging from 99.6% for the implanting hospital to 37.1% for QRS width. Finally, the percentage of complications reported to the registry fails to reflect reality because these data are provided during or immediately after the implantation, meaning that most subacute complications are not recorded.
Future Prospects of the Spanish Implantable Cardioverter-defibrillator RegistryThis registry is the XI official report. The durability of this registry is a credit to all of the participating members of the Section of Electrophysiology and Arrhythmias of the SEC. The continued modernization of the registry will allow more and better information to be obtained with less effort on the part of the staff involved in its maintenance. The quality of the information will improve with further computerization of the registry, and the completion of certain fields will be obligatory. In the future, it may permit more ambitious clinical objectives and include parameters such as death, shocks, and complications that provide relevant clinical information.
CONCLUSIONSThe 2014 Spanish Implantable Cardioverter-defibrillator Registry collected information on 82% of all implantations performed in Spain and continues to be representative of the activity and current indications of this therapy in Spain. After 2 years of decreases in the number of implantations, a recovery was seen in 2013, which was confirmed this year with a figure of 106 per million population. As in previous years, the total number of implantations in Spain continues to be much lower than the average for the European Union, with the difference continuing to grow, and the autonomous communities continue to show considerable variability.
CONFLICTS OF INTERESTSJ. Alzueta has participated in research projects with St. Jude Medical, Medtronic, Boston Scientific, Biotronik, and the Sorin Group. A. Aso has participated in research projects sponsored by Medtronic, St. Jude Medical, and Boston Scientific. A. Quesada has participated in talks and round tables sponsored by Medtronic and the Sorin Group.
We would like to thank all of the health care professionals involved in ICD implantation in Spain who have voluntarily and selflessly contributed to the ultimate success of the registry. We also thank José María Fernández, an SEC fellow who maintains the database of the Spanish Implantable Cardioverter-defibrillator Registry, for his enthusiastic work in maintaining the database and his participation in its development. Our thanks also go to the personnel at the ICD manufacturers (Medtronic, Boston Scientific, St. Jude Medical, Biotronik, and the Sorin Group) for their help in collecting and sending datasheets to the SEC for most of the implantations. Finally, we thank the SEC for its work in receiving the information, particularly Gonzalo Justes and José María Naranjo.