Ischemic heart disease (IHD) is the leading cause of death and one of the leading causes of disability. The aim of this study was to analyze trends in premature mortality due to IHD in patients younger than 75 years in Spain from 1998 to 2018 by region.
MethodsObservational study of temporal trends in premature mortality due to IHD in Spain by region and sex from 1998 to 2018. The study population included resident citizens aged between 0 and 74 years. The data sources were the continuous population register and the mortality registry of the National Institute of Statistics. We calculated age-adjusted mortality rates and their average annual percent change estimated by Poisson models.
ResultsDuring the study period, mortality rates due to IHD decreased, both in the country as a whole and by provinces (53% in men and 61% in women), with an average annual percent change of –3.92% and –5.07%, respectively. In the first year (1998), mortality was unequally distributed among provinces, with higher mortality in the south of Spain.
ConclusionsPremature mortality due to IHD significantly decreased in Spain during the study period in both sexes to roughly half of initial cases. This decrease was statistically significant in almost all regions. Interprovincial differences in mortality and their variation also decreased in recent years.
Keywords
Cardiovascular disease is the leading cause of death1 and hospitalization2 in Spain and in the European Union.3 Ischemic heart disease (IHD) is itself the most common cause of cardiovascular mortality4 and the primary cause of death worldwide.5 In Spain, death due to IHD reached 7.8% of all deaths in 2016, with significant differences by sex. The percentage is higher in men, in whom it has been the leading cause of death since 1987; meanwhile, it is the second most common cause of death in women after stroke.4,6
In developed countries, death due to IHD has fallen since 1975, although the reduction has slowed since 1990.7,8 The decline has been attributed both to improved treatment of acute coronary syndrome and to preventive measures.9 The incidence of IHD significantly differs by age and sex,10 similar to IHD mortality,11 which rapidly increases with age, and the rates in women are approximately the same as those of men who are 10 years younger.
Prevalence also increases with age and differs by sex. Data from the United States show a predominance of men in terms of both overall IHD and myocardial infarction in particular in all age groups.12 In Spain, there are no data on the true prevalence of IHD but population surveys13 include myocardial infarction and permit indirect estimates, which indicate lower rates vs America at all ages and a reduction from 2006 to 2012.9
In addition to premature mortality (PM) due to IHD, people who survive the acute phase become chronic patients, with slow progression and quality of life limitations that affect their caregivers. The economic effects are considerable for families and society and undermine the sustainability of the health care system. Accordingly, cardiovascular disease is estimated to cause more than 50% of health expenditure costs and almost 25% of productivity losses in Europe.14 Thus, our actions must include deep and ongoing studies.
Previous studies of death due to IHD in Spain2,15–17 differ in the periods covered and other parameters. In contrast to the present study, none included data until 2018 differentiated by sex and region. PM due to IHD has also not been studied by autonomous community (AC), unlike that due to heart failure.18 Accordingly, the objective of this study was to analyze the trends in PM due to IHD in Spain from 1998 to 2018 by province.
METHODSThis observational study examined trends in PM due to IHD in Spain by province from 1998 to 2018. PM was defined as any death due to IHD in individuals younger than 75 years old (key indicators for the Spanish National Health System19). PM due to IHD was analyzed in residents of Spain aged between 0 and 74 years and by province. A national analysis was also performed of groups aged 0 to 34, 35 to 64, and 65 to 74 years. The basic cause of death was defined by ICD-9 codes 410 to 414 (1998) and ICD-10 codes I20 to I25 (1999-2018) of the International Classification of Diseases (ICD) Ninth and Tenth revisions. We excluded patients with no record of their province of residence.
The population data source used was the continuous population register of the Spanish National Institute of Statistics (INE).20 We additionally used the cause of death recorded in the mortality registry, also available at the electronic portal of this institute.
The study variables were populations by age, sex, year, and province of residence, as well as province of residence, age in years, sex, and year of death.
Statistical analysisAge-adjusted mortality rates (AAMRs)/100 000 population were calculated via the direct method, as well as their corresponding 95% confidence intervals (95%CIs), by age and sex and both nationally and for each province. For standardization, we used the European standard population for 2013 published by Eurostat21; the population each year was divided into 5-year age groups by province and sex, with the corresponding 95%CI, and truncated rates were calculated in each age group. Although the objective of this study was centered on PM, the national AAMR was also calculated in individuals older than 74 years by age and sex to fully analyze the mortality trends. To assess the change in mortality over the study period, Poisson regression models were adjusted to the logarithm of the number of deaths, using the logarithm of the population as offset and adjusting by groups aged <50, 50 to 64, and 65 to 74 years. The average annual percent change (AAPC) in mortality was estimated using the expression (exp(β) – 1)·100%, where β corresponds to the variable year of death. The 95%CI was calculated for the AAPC and the values were estimated by province and sex. All analyses were performed with the statistical program R 4.0.2.22
RESULTSIn total, 232 617 premature deaths due to IHD were analyzed during the study period; 181 424 (78.0%) occurred in men and 51 193 (22.0%) in women.
In 1998, PM due to IHD occurred in 14 876 people in Spain, 11 234 men (75.5%) and 3642 women (24.5%). In 2018, PM due to IHD occurred in 8780, 7036 men (80.1%) and 1744 women (19.8%). PM due to IHD in individuals younger than 75 years represented 30.9% of total mortality due to IHD. and show the number of deaths and the AAMRs and 95%CIs of death due to IHD in Spain by province during the entire study period and in both sexes.
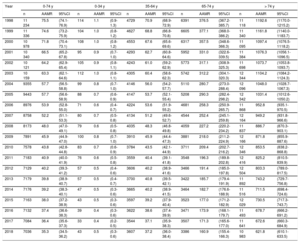
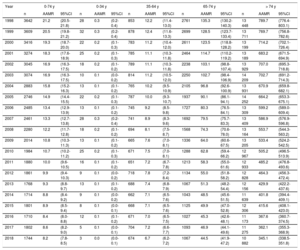
Table 1 and table 2 show the national AAMR of all years for men and women, respectively, with those younger than 74 years differentiated by groups aged 0 to 34, 45 to 64, and 65 to 74 years, in addition to those aged> 74 years. There was a fall in the mortality rates of all age groups, although it was more pronounced in those older than 35 years, in both men and women. Although the magnitude of the mortality due to IHD was much higher in people older than 74 years, a similar decreasing pattern was detected in both age groups during the study period.
Death due to ischemic heart disease in men in Spain by age group from 1998 to 2018
| Year | 0-74 y | 0-34 y | 35-64 y | 65-74 y | > 74 y | ||||||||||
|---|---|---|---|---|---|---|---|---|---|---|---|---|---|---|---|
| n | AAMR | 95%CI | n | AAMR | 95%CI | n | AAMR | 95%CI | n | AAMR | 95%CI | n | AAMR | 95%CI | |
| 1998 | 11 234 | 75.5 | (74.1-76.9) | 114 | 1.1 | (0.9-1.3) | 4729 | 70.9 | (68.9-72.9) | 6391 | 376.5 | (367.2-385.7) | 11 118 | 1192.6 | (1170.0-1215.2) |
| 1999 | 11 336 | 74.6 | (73.2-75.9) | 104 | 1.0 | (0.8-1.2) | 4627 | 68.8 | (66.8-70.8) | 6605 | 377.1 | (368.0-386.2) | 11 340 | 1161.8 | (1140.0-1183.7) |
| 2000 | 10 978 | 71.8 | (70.4-73.1) | 108 | 1.0 | (0.8-1.2) | 4553 | 67.6 | (65.6-69.6) | 6317 | 357.5 | (348.6-366.3) | 11 095 | 1097.4 | (1076.5-1118.2) |
| 2001 | 10 340 | 66.5 | (65.2-67.8) | 95 | 0.9 | (0.7-1.0) | 4293 | 62.7 | (60.8-64.6) | 5952 | 331.0 | (322.6-339.5) | 11 384 | 1076.3 | (1056.1-1096.5) |
| 2002 | 10 121 | 64.2 | (62.9-65.4) | 105 | 0.9 | (0.8-1.1) | 4243 | 61.0 | (59.2-62.9) | 5773 | 317.1 | (308.9-325.3) | 11 698 | 1073.7 | (1053.8-1093.7) |
| 2003 | 10 159 | 63.3 | (62.1-64.6) | 112 | 1.0 | (0.8-1.1) | 4305 | 60.4 | (58.6-62.3) | 5742 | 312.2 | (304.1-320.3) | 12 344 | 1104.2 | (1084.2-1124.3) |
| 2004 | 9355 | 57.7 | (56.5-58.8) | 99 | 0.8 | (0.7-1.0) | 4146 | 56.0 | (54.2-57.7) | 5110 | 280.7 | (273.0-288.4) | 12 096 | 1048.0 | (1028.7-1067.3) |
| 2005 | 9443 | 57.7 | (56.6-58.9) | 88 | 0.7 | (0.6-0.9) | 4147 | 53.7 | (52.1-55.4) | 5208 | 290.3 | (282.4-298.2) | 12 342 | 1031.4 | (1012.6-1050.2) |
| 2006 | 8976 | 53.9 | (52.8-55.0) | 71 | 0.6 | (0.4-0.7) | 4224 | 53.6 | (51.9-55.2) | 4681 | 258.3 | (250.9-265.7) | 11 868 | 952.8 | (935.1-970.5) |
| 2007 | 8758 | 52.2 | (51.1-53.3) | 80 | 0.7 | (0.5-0.8) | 4134 | 51.2 | (49.6-52.7) | 4544 | 252.4 | (245.1-259.8) | 12 164 | 949.2 | (931.8-966.6) |
| 2008 | 8173 | 48.0 | (47.0-49.1) | 79 | 0.6 | (0.5-0.8) | 4035 | 48.3 | (46.8-49.8) | 4059 | 227.2 | (220.2-234.2) | 11 837 | 886.7 | (870.3-903.1) |
| 2009 | 7891 | 45.9 | (44.9-47.0) | 100 | 0.8 | (0.7-1.0) | 3910 | 45.9 | (44.4-47.3) | 3881 | 218.0 | (211.2-224.9) | 12 166 | 871.8 | (855.9-887.6) |
| 2010 | 7578 | 43.8 | (42.8-44.8) | 83 | 0.7 | (0.6-0.9) | 3784 | 43.5 | (42.1-44.9) | 3711 | 209.4 | (202.7-216.2) | 12 346 | 853.5 | (838.2-868.8) |
| 2011 | 7183 | 40.9 | (40.0-41.9) | 76 | 0.6 | (0.5-0.8) | 3559 | 40.4 | (39.1-41.8) | 3548 | 196.3 | (189.8-202.8) | 12 416 | 825.2 | (810.5-839.9) |
| 2012 | 7129 | 40.2 | (39.3-41.2) | 57 | 0.5 | (0.4-0.6) | 3606 | 40.2 | (38.9-41.6) | 3466 | 191.4 | (185.0-197.8) | 12 504 | 803.3 | (789.0-817.5) |
| 2013 | 7179 | 39.8 | (38.9-40.7) | 57 | 0.5 | (0.4-0.7) | 3700 | 40.8 | (39.5-42.1) | 3422 | 185.7 | (179.4-191.9) | 11 892 | 743.2 | (729.7-756.8) |
| 2014 | 7176 | 39.2 | (38.3-40.1) | 47 | 0.5 | (0.3-0.6) | 3665 | 40.2 | (38.9-41.5) | 3464 | 182.7 | (176.6-188.9) | 11 516 | 711.5 | (698.4-724.6) |
| 2015 | 7163 | 38.0 | (37.2-38.9) | 43 | 0.5 | (0.3-0.6) | 3597 | 39.2 | (37.9-40.4) | 3523 | 177.0 | (171.2-182.9) | 12 029 | 730.5 | (717.3-743.7) |
| 2016 | 7132 | 37.4 | (36.6-38.3) | 39 | 0.4 | (0.3-0.6) | 3622 | 38.6 | (37.4-39.9) | 3471 | 173.9 | (168.1-179.7) | 11 493 | 678.7 | (666.2-691.2) |
| 2017 | 7084 | 36.4 | (35.6-37.3) | 33 | 0.4 | (0.2-0.5) | 3544 | 37.1 | (35.9-38.3) | 3507 | 171.3 | (165.6-177.0) | 11 641 | 672.6 | (660.3-684.9) |
| 2018 | 7036 | 35.3 | (34.5-36.2) | 43 | 0.5 | (0.3-0.6) | 3607 | 37.2 | (36.0-38.4) | 3386 | 160.9 | (155.4-166.3) | 10 983 | 621.8 | (610.1-633.5) |
95%CI, 95% confidence interval; AAMRs, age-adjusted mortality rates/100 000 population (direct method, European standard population for 2013).
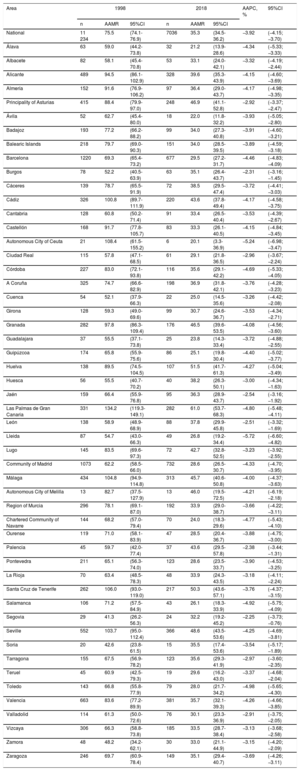
Death due to ischemic heart disease in women in Spain by age group from 1998 to 2018
| Year | 0-74 y | 0-34 y | 35-64 y | 65-74 y | > 74 y | ||||||||||
|---|---|---|---|---|---|---|---|---|---|---|---|---|---|---|---|
| n | AAMR | 95%CI | n | AAMR | 95%CI | n | AAMR | 95%CI | n | AAMR | 95%CI | n | AAMR | 95%CI | |
| 1998 | 3642 | 21.2 | (20.5-21.8) | 28 | 0.3 | (0.2-0.4) | 853 | 12.2 | (11.4-13.0) | 2761 | 135.3 | (130.2-140.3) | 13 448 | 789.7 | (776.4-803.1) |
| 1999 | 3609 | 20.5 | (19.8-21.2) | 32 | 0.3 | (0.2-0.4) | 878 | 12.4 | (11.6-13.3) | 2699 | 128.5 | (123.7-133.4) | 13 711 | 769.7 | (756.8-782.6) |
| 2000 | 3416 | 19.3 | (18.7-20.0) | 22 | 0.2 | (0.1-0.3) | 783 | 11.2 | (10.4-12.0) | 2611 | 123.5 | (118.8-128.2) | 13 199 | 714.2 | (702.1-726.4) |
| 2001 | 3274 | 18.3 | (17.6-18.9) | 25 | 0.2 | (0.1-0.3) | 785 | 11.1 | (10.3-11.8) | 2464 | 114.7 | (110.2-119.2) | 13 189 | 683.2 | (671.5-694.9) |
| 2002 | 3045 | 16.9 | (16.3-17.5) | 18 | 0.2 | (0.1-0.2) | 789 | 11.1 | (10.3-11.8) | 2238 | 103.1 | (98.8-107.4) | 13 929 | 707.0 | (695.3-718.8) |
| 2003 | 3074 | 16.9 | (16.3-17.5) | 10 | 0.1 | (0.0-0.2) | 814 | 11.2 | (10.5-12.0) | 2250 | 102.7 | (98.4-106.9) | 14 209 | 702.7 | (691.2-714.3) |
| 2004 | 2883 | 15.8 | (15.2-16.3) | 13 | 0.1 | (0.1-0.2) | 765 | 10.2 | (9.5-10.9) | 2105 | 96.8 | (92.6-100.9) | 13 931 | 670.9 | (659.8-682.1) |
| 2005 | 2746 | 14.9 | (14.4-15.5) | 22 | 0.2 | (0.1-0.3) | 787 | 10.0 | (9.3-10.7) | 1937 | 90.1 | (86.1-94.1) | 14 252 | 664.2 | (653.3-675.1) |
| 2006 | 2485 | 13.4 | (12.9-13.9) | 13 | 0.1 | (0.1-0.2) | 745 | 9.2 | (8.5-9.8) | 1727 | 80.3 | (76.5-84.1) | 13 309 | 599.2 | (589.0-609.4) |
| 2007 | 2461 | 13.3 | (12.7-13.8) | 28 | 0.3 | (0.2-0.4) | 741 | 8.9 | (8.3-9.6) | 1692 | 79.5 | (75.7-83.3) | 13 409 | 586.9 | (576.9-596.8) |
| 2008 | 2280 | 12.2 | (11.7-12.8) | 18 | 0.2 | (0.1-0.2) | 694 | 8.1 | (7.5-8.7) | 1568 | 74.3 | (70.6-78.0) | 13 164 | 553.7 | (544.3-563.2) |
| 2009 | 2014 | 10.8 | (10.3-11.3) | 13 | 0.1 | (0.1-0.2) | 665 | 7.6 | (7.0-8.1) | 1336 | 64.0 | (60.6-67.5) | 13 205 | 533.4 | (524.2-542.5) |
| 2010 | 1984 | 10.7 | (10.2-11.2) | 25 | 0.2 | (0.1-0.3) | 671 | 7.5 | (7.0-8.1) | 1288 | 62.8 | (59.4-66.2) | 12 967 | 505.2 | (496.5-513.9) |
| 2011 | 1880 | 10.0 | (9.6-10.5) | 16 | 0.1 | (0.1-0.2) | 651 | 7.2 | (6.7-7.8) | 1213 | 58.3 | (55.0-61.6) | 12 933 | 485.2 | (476.8-493.6) |
| 2012 | 1861 | 9.9 | (9.4-10.3) | 9 | 0.1 | (0.0-0.2) | 718 | 7.8 | (7.2-8.4) | 1134 | 55.0 | (51.8-58.2) | 12 828 | 464.3 | (456.3-472.4) |
| 2013 | 1768 | 9.3 | (8.8-9.7) | 13 | 0.1 | (0.1-0.2) | 688 | 7.4 | (6.8-7.9) | 1067 | 51.3 | (48.2-54.4) | 12 156 | 429.9 | (422.2-437.6) |
| 2014 | 1714 | 8.8 | (8.4-9.2) | 9 | 0.1 | (0.0-0.2) | 662 | 7.1 | (6.5-7.6) | 1043 | 48.5 | (45.6-51.5) | 11 639 | 401.8 | (394.4-409.1) |
| 2015 | 1801 | 8.9 | (8.5-9.4) | 8 | 0.1 | (0.0-0.1) | 668 | 7.1 | (6.5-7.6) | 1125 | 49.9 | (47.0-52.8) | 12 306 | 415.6 | (408.1-423.0) |
| 2016 | 1710 | 8.4 | (8.0-8.8) | 12 | 0.1 | (0.1-0.2) | 671 | 7.0 | (6.5-7.5) | 1027 | 45.3 | (42.6-48.1) | 11 173 | 367.6 | (360.7-374.5) |
| 2017 | 1802 | 8.6 | (8.2-9.0) | 5 | 0.1 | (0.0-0.1) | 704 | 7.2 | (6.6-7.7) | 1093 | 46.9 | (44.1-49.6) | 11 275 | 362.1 | (355.3-368.9) |
| 2018 | 1744 | 8.2 | (7.8-8.5) | 3 | 0.0 | (0.0-0.1) | 674 | 6.7 | (6.2-7.2) | 1067 | 44.5 | (41.9-47.2) | 10 882 | 345.1 | (338.5-351.8) |
95%CI, 95% confidence interval; AAMRs, age-adjusted mortality rates/100 000 population (direct method, European standard population for 2013).
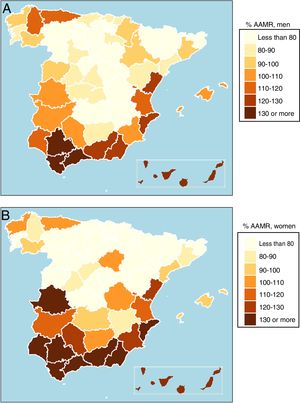
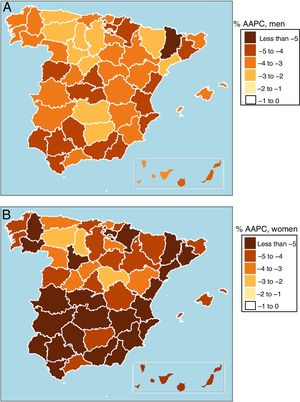
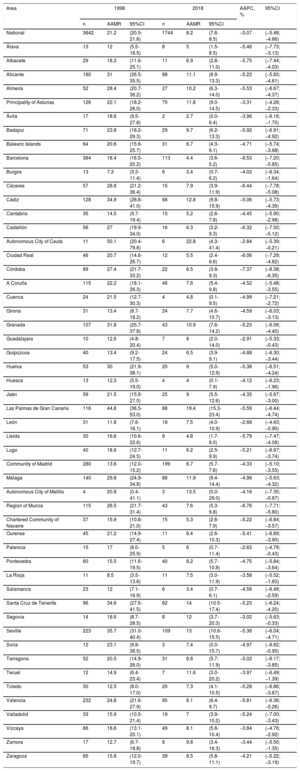
Table 3 shows the national AAMRs and those of each province in 1998 and 2018 for men, as well as the AAPC and 95%CI for the entire period. The national AAMR for men was 75.5 deaths/100 000 population in 1998 and 35.3/100 000 in 2018. Regarding the values of the AAPC index in men during the study period, the national average changed by −3.92% per year (Table 3). The geographical distribution of the provincial variations in the mortality rates of men in 1998 are presented in figure 1. Higher-than-average rates were found in Andalusia, the Valencian Community, and the nonmainland autonomous communities, followed by Extremadura and Region of Murcia. In the north half of the country, higher-than-average rates were only seen in Principality of Asturias and the province of Lugo. There was a significant decrease in the AAPC of men during the study period in all provinces (figure 2).
Premature mortality due to ischemic heart disease in men in Spanish provinces and the average annual percent change between 1998 and 2018
| Area | 1998 | 2018 | AAPC, % | 95%CI | ||||
|---|---|---|---|---|---|---|---|---|
| n | AAMR | 95%CI | n | AAMR | 95%CI | |||
| National | 11 234 | 75.5 | (74.1-76.9) | 7036 | 35.3 | (34.5-36.2) | −3.92 | (−4.15; −3.70) |
| Álava | 63 | 59.0 | (44.2-73.8) | 32 | 21.2 | (13.9-28.6) | −4.34 | (−5.33; −3.33) |
| Albacete | 82 | 58.1 | (45.4-70.8) | 53 | 33.1 | (24.0-42.1) | −3.32 | (−4.19; −2.44) |
| Alicante | 489 | 94.5 | (86.1-102.9) | 328 | 39.6 | (35.3-43.9) | −4.15 | (−4.60; −3.69) |
| Almería | 152 | 91.6 | (76.9-106.2) | 97 | 36.4 | (29.0-43.7) | −4.17 | (−4.98; −3.35) |
| Principality of Asturias | 415 | 88.4 | (79.9-97.0) | 248 | 46.9 | (41.1-52.8) | −2.92 | (−3.37; −2.47) |
| Ávila | 52 | 62.7 | (45.4-80.0) | 18 | 22.0 | (11.8-32.2) | −3.93 | (−5.05; −2.80) |
| Badajoz | 193 | 77.2 | (66.2-88.2) | 99 | 34.0 | (27.3-40.8) | −3.91 | (−4.60; −3.21) |
| Balearic Islands | 218 | 79.7 | (69.0-90.3) | 151 | 34.0 | (28.5-39.5) | −3.89 | (−4.59; −3.18) |
| Barcelona | 1220 | 69.3 | (65.4-73.2) | 677 | 29.5 | (27.2-31.7) | −4.46 | (−4.83; −4.09) |
| Burgos | 78 | 52.2 | (40.5-63.9) | 63 | 35.1 | (26.4-43.7) | −2.31 | (−3.16; −1.45) |
| Cáceres | 139 | 78.7 | (65.5-91.9) | 72 | 38.5 | (29.5-47.4) | −3.72 | (−4.41; −3.03) |
| Cádiz | 326 | 100.8 | (89.7-111.9) | 220 | 43.6 | (37.8-49.4) | −4.17 | (−4.58; −3.75) |
| Cantabria | 128 | 60.8 | (50.2-71.4) | 91 | 33.4 | (26.5-40.4) | −3.53 | (−4.39; −2.67) |
| Castellón | 168 | 91.7 | (77.8-105.7) | 83 | 33.3 | (26.1-40.5) | −4.15 | (−4.84; −3.45) |
| Autonomous City of Ceuta | 21 | 108.4 | (61.5-155.2) | 6 | 20.1 | (3.3-36.9) | −5.24 | (−6.98; −3.47) |
| Ciudad Real | 115 | 57.8 | (47.1-68.5) | 61 | 29.1 | (21.8-36.5) | −2.96 | (−3.67; −2.24) |
| Córdoba | 227 | 83.0 | (72.1-93.8) | 116 | 35.6 | (29.1-42.2) | −4.69 | (−5.33; −4.05) |
| A Coruña | 325 | 74.7 | (66.6-82.9) | 198 | 36.9 | (31.8-42.1) | −3.76 | (−4.28; −3.23) |
| Cuenca | 54 | 52.1 | (37.9-66.3) | 22 | 25.0 | (14.5-35.6) | −3.26 | (−4.42; −2.08) |
| Girona | 128 | 59.3 | (49.0-69.6) | 99 | 30.7 | (24.6-36.7) | −3.53 | (−4.34; −2.71) |
| Granada | 282 | 97.8 | (86.3-109.4) | 176 | 46.5 | (39.6-53.5) | −4.08 | (−4.56; −3.60) |
| Guadalajara | 37 | 55.5 | (37.1-73.8) | 25 | 23.8 | (14.3-33.4) | −3.72 | (−4.88; −2.55) |
| Guipúzcoa | 174 | 65.8 | (55.9-75.6) | 86 | 25.1 | (19.8-30.4) | −4.40 | (−5.02; −3.77) |
| Huelva | 138 | 89.5 | (74.5-104.5) | 107 | 51.5 | (41.7-61.3) | −4.27 | (−5.04; −3.49) |
| Huesca | 56 | 55.5 | (40.7-70.2) | 40 | 38.2 | (26.3-50.1) | −3.00 | (−4.34; −1.63) |
| Jaén | 159 | 66.4 | (55.9-76.8) | 95 | 36.3 | (28.9-43.7) | −2.54 | (−3.16; −1.92) |
| Las Palmas de Gran Canaria | 331 | 134.2 | (119.3-149.1) | 282 | 61.0 | (53.7-68.3) | −4.80 | (−5.48; −4.11) |
| León | 138 | 58.9 | (48.9-68.9) | 88 | 37.8 | (29.9-45.8) | −2.51 | (−3.32; −1.69) |
| Lleida | 87 | 54.7 | (43.0-66.3) | 49 | 26.8 | (19.2-34.4) | −5.72 | (−6.60; −4.82) |
| Lugo | 145 | 83.5 | (69.6-97.3) | 72 | 42.7 | (32.8-52.5) | −3.23 | (−3.92; −2.55) |
| Community of Madrid | 1073 | 62.2 | (58.5-66.0) | 732 | 28.6 | (26.5-30.7) | −4.33 | (−4.70; −3.95) |
| Málaga | 434 | 104.8 | (94.9-114.8) | 313 | 45.7 | (40.6-50.8) | −4.00 | (−4.37; −3.63) |
| Autonomous City of Melilla | 13 | 82.7 | (37.5-127.9) | 13 | 46.0 | (19.5-72.5) | −4.21 | (−6.19; −2.18) |
| Region of Murcia | 296 | 78.1 | (69.1-87.0) | 192 | 33.9 | (29.0-38.7) | −3.66 | (−4.22; −3.11) |
| Chartered Community of Navarre | 144 | 68.2 | (57.0-79.4) | 70 | 24.0 | (18.3-29.6) | −4.77 | (−5.43; −4.10) |
| Ourense | 119 | 71.0 | (58.1-83.9) | 47 | 28.5 | (20.4-36.7) | −3.88 | (−4.75; −3.00) |
| Palencia | 45 | 59.7 | (42.0-77.4) | 37 | 43.6 | (29.5-57.8) | −2.38 | (−3.44; −1.31) |
| Pontevedra | 211 | 65.1 | (56.3-74.0) | 123 | 28.6 | (23.5-33.7) | −3.90 | (−4.53; −3.25) |
| La Rioja | 70 | 63.4 | (48.5-78.3) | 48 | 33.9 | (24.3-43.5) | −3.18 | (−4.11; −2.24) |
| Santa Cruz de Tenerife | 262 | 106.0 | (93.0-119.0) | 217 | 50.3 | (43.6-57.1) | −3.76 | (−4.37; −3.15) |
| Salamanca | 106 | 71.2 | (57.5-84.9) | 43 | 26.1 | (18.3-33.9) | −4.92 | (−5.75; −4.09) |
| Segovia | 29 | 41.3 | (26.2-56.3) | 24 | 32.2 | (19.2-45.2) | −2.25 | (−3.73; −0.76) |
| Seville | 552 | 103.7 | (95.0-112.4) | 366 | 48.6 | (43.5-53.6) | −4.25 | (−4.69; −3.81) |
| Soria | 20 | 42.6 | (23.8-61.5) | 15 | 35.5 | (17.4-53.6) | −3.54 | (−5.17; −1.89) |
| Tarragona | 155 | 67.5 | (56.9-78.2) | 123 | 35.6 | (29.3-41.9) | −2.97 | (−3.60; −2.35) |
| Teruel | 45 | 60.9 | (42.5-79.3) | 19 | 29.6 | (16.2-43.0) | −3.37 | (−4.68; −2.04) |
| Toledo | 143 | 66.8 | (55.8-77.9) | 79 | 28.0 | (21.7-34.2) | −4.98 | (−5.65; −4.30) |
| Valencia | 663 | 83.6 | (77.2-89.9) | 381 | 35.7 | (32.1-39.3) | −4.26 | (−4.66; −3.85) |
| Valladolid | 114 | 61.3 | (50.0-72.6) | 76 | 30.1 | (23.3-36.9) | −2.91 | (−3.75; −2.05) |
| Vizcaya | 306 | 66.3 | (58.8-73.8) | 185 | 33.5 | (28.7-38.4) | −3.13 | (−3.68; −2.58) |
| Zamora | 48 | 48.2 | (34.2-62.1) | 30 | 33.0 | (21.1-44.9) | −3.15 | (−4.20; −2.09) |
| Zaragoza | 246 | 69.7 | (60.9-78.4) | 149 | 35.1 | (29.4-40.7) | −3.69 | (−4.26; −3.11) |
95%CI, 95% confidence interval; AAMRs, age-adjusted mortality rates/100 000 population (direct method, European standard population for 2013); AAPC, average annual percent change estimated by Poisson models.
 vs the national rate (75.5 deaths/100 000 population). B: mortality rate in women (percentage) vs the national rate (21.2 deaths/100 000 population). AAMR, age-adjusted mortality rate.")
Territorial differences in death due to ischemic heart disease in 1998. A: mortality rate in men (percentage) vs the national rate (75.5 deaths/100 000 population). B: mortality rate in women (percentage) vs the national rate (21.2 deaths/100 000 population). AAMR, age-adjusted mortality rate.
 by province from 1998 to 2018. A: men. B: women.")
In women, the national AAMRs were 21.2 deaths/100 000 population in 1998 and 8.2/100 000 in 2018 (table 4). The AAPC index values in women during the entire period were always negative and significant in all Spanish provinces, with a national average of −5.07%. The lower part of figure 1 illustrates the geographical distribution of the provincial variations in the mortality rates of women in 1998. The most unfavorable rates were found in the autonomous communities in the south and east, as well as in the Autonomous City of Melilla. In the north, only the Principality of Asturias and the province of A Coruña slightly exceeded the average. In the center, in contrast to the situation for men, higher-than-average rates were found in the provinces of Soria and Cuenca. As shown in the lower part of figure 2, the AAPC of women significantly decreased in all provinces.
Premature mortality due to ischemic heart disease in women in Spanish provinces and the average annual percent change between 1998 and 2018
| Area | 1998 | 2018 | AAPC, % | 95%CI | ||||
|---|---|---|---|---|---|---|---|---|
| n | AAMR | 95%CI | n | AAMR | 95%CI | |||
| National | 3642 | 21.2 | (20.5-21.8) | 1744 | 8.2 | (7.8-8.5) | −5.07 | (−5.48; −4.66) |
| Álava | 13 | 12 | (5.5-18.5) | 8 | 5 | (1.5-8.5) | −5.46 | (−7.73; −3.13) |
| Albacete | 29 | 18.3 | (11.6-25.1) | 11 | 6.9 | (2.8-11.0) | −5.75 | (−7.44; −4.03) |
| Alicante | 180 | 31 | (26.5-35.5) | 98 | 11.1 | (8.9-13.3) | −5.22 | (−5.83; −4.61) |
| Almería | 52 | 28.4 | (20.7-36.2) | 27 | 10.2 | (6.3-14.0) | −5.53 | (−6.67; −4.37) |
| Principality of Asturias | 126 | 22.1 | (18.2-26.0) | 70 | 11.8 | (9.0-14.5) | −3.31 | (−4.28; −2.33) |
| Ávila | 17 | 18.6 | (9.5-27.8) | 2 | 2.7 | (0.0-6.4) | −3.96 | (−6.16; −1.70) |
| Badajoz | 71 | 23.8 | (18.2-29.3) | 29 | 9.7 | (6.2-13.3) | −5.92 | (−6.91; −4.92) |
| Balearic Islands | 64 | 20.6 | (15.6-25.7) | 31 | 6.7 | (4.3-9.1) | −4.71 | (−5.74; −3.68) |
| Barcelona | 384 | 18.4 | (16.5-20.2) | 113 | 4.4 | (3.6-5.2) | −6.53 | (−7.20; −5.85) |
| Burgos | 13 | 7.3 | (3.3-11.4) | 6 | 3.4 | (0.7-6.2) | −4.02 | (−6.34; −1.64) |
| Cáceres | 57 | 28.8 | (21.2-36.4) | 15 | 7.9 | (3.9-11.9) | −6.44 | (−7.78; −5.08) |
| Cádiz | 128 | 34.9 | (28.8-41.0) | 68 | 12.8 | (9.8-15.9) | −5.06 | (−5.73; −4.39) |
| Cantabria | 35 | 14.5 | (9.7-19.4) | 15 | 5.2 | (2.6-7.8) | −4.45 | (−5.90; −2.98) |
| Castellón | 56 | 27 | (19.9-34.0) | 16 | 6.3 | (3.2-9.3) | −6.32 | (−7.50; −5.12) |
| Autonomous City of Ceuta | 11 | 50.1 | (20.4-79.8) | 6 | 22.8 | (4.3-41.4) | −2.84 | (−5.39; −0.21) |
| Ciudad Real | 46 | 20.7 | (14.6-26.7) | 12 | 5.5 | (2.4-8.6) | −6.06 | (−7.29; −4.82) |
| Córdoba | 89 | 27.4 | (21.7-33.2) | 22 | 6.5 | (3.8-9.3) | −7.37 | (−8.38; −6.35) |
| A Coruña | 115 | 22.2 | (18.1-26.3) | 46 | 7.6 | (5.4-9.8) | −4.52 | (−5.48; −3.55) |
| Cuenca | 24 | 21.5 | (12.7-30.3) | 4 | 4.8 | (0.1-9.5) | −4.99 | (−7.21; −2.72) |
| Girona | 31 | 13.4 | (8.7-18.2) | 24 | 7.7 | (4.6-10.7) | −4.59 | (−6.03; −3.13) |
| Granada | 107 | 31.8 | (25.7-37.8) | 43 | 10.9 | (7.6-14.2) | −5.23 | (−6.06; −4.40) |
| Guadalajara | 10 | 12.6 | (4.8-20.4) | 7 | 8 | (2.0-14.0) | −2.91 | (−5.33; −0.43) |
| Guipúzcoa | 40 | 13.4 | (9.2-17.5) | 24 | 6.5 | (3.9-9.1) | −4.88 | (−6.30; −3.44) |
| Huelva | 53 | 30 | (21.9-38.1) | 20 | 9 | (5.0-12.9) | −5.38 | (−6.51; −4.24) |
| Huesca | 13 | 12.3 | (5.5-19.0) | 4 | 4 | (0.1-7.9) | −4.12 | (−6.23; −1.96) |
| Jaén | 59 | 21.5 | (15.9-27.0) | 25 | 9 | (5.5-12.6) | −4.35 | (−5.67; −3.00) |
| Las Palmas de Gran Canaria | 116 | 44.8 | (36.5-53.0) | 88 | 19.4 | (15.3-23.4) | −5.59 | (−6.44; −4.74) |
| León | 31 | 11.8 | (7.6-16.1) | 18 | 7.5 | (4.0-10.9) | −2.68 | (−4.43; −0.90) |
| Lleida | 30 | 16.6 | (10.6-22.6) | 9 | 4.8 | (1.7-8.0) | −5.79 | (−7.47; −4.08) |
| Lugo | 40 | 18.6 | (12.7-24.5) | 11 | 6.2 | (2.5-9.9) | −5.21 | (−6.67; −3.74) |
| Community of Madrid | 280 | 13.6 | (12.0-15.2) | 199 | 6.7 | (5.7-7.6) | −4.33 | (−5.10; −3.55) |
| Málaga | 140 | 29.8 | (24.9-34.8) | 88 | 11.9 | (9.4-14.4) | −4.98 | (−5.63; −4.32) |
| Autonomous City of Melilla | 4 | 20.8 | (0.4-41.1) | 3 | 13.5 | (0.0-29.0) | −4.16 | (−7.35; −0.87) |
| Region of Murcia | 115 | 26.5 | (21.7-31.4) | 43 | 7.6 | (5.3-9.8) | −6.76 | (−7.71; −5.80) |
| Chartered Community of Navarre | 37 | 15.9 | (10.8-21.0) | 15 | 5.3 | (2.6-7.9) | −5.22 | (−6.84; −3.57) |
| Ourense | 45 | 21.2 | (14.9-27.4) | 11 | 6.4 | (2.6-10.3) | −5.41 | (−6.89; −3.90) |
| Palencia | 15 | 17 | (8.0-25.9) | 5 | 6 | (0.7-11.4) | −2.63 | (−4.79; −0.43) |
| Pontevedra | 60 | 15.5 | (11.6-19.5) | 40 | 8.2 | (5.7-10.8) | −4.75 | (−5.84; −3.64) |
| La Rioja | 11 | 8.5 | (3.5-13.6) | 11 | 7.5 | (3.0-11.9) | −3.58 | (−5.52; −1.60) |
| Salamanca | 23 | 12 | (7.1-16.9) | 6 | 3.4 | (0.7-6.1) | −4.56 | (−6.48; −2.59) |
| Santa Cruz de Tenerife | 96 | 34.6 | (27.6-41.5) | 62 | 14 | (10.5-17.4) | −5.23 | (−6.24; −4.20) |
| Segovia | 14 | 18.6 | (8.7-28.5) | 8 | 12 | (3.7-20.3) | −3.02 | (−5.63; −0.33) |
| Seville | 223 | 35.7 | (31.0-40.4) | 109 | 13 | (10.6-15.5) | −5.38 | (−6.04; −4.71) |
| Soria | 12 | 23.1 | (9.8-36.5) | 3 | 7.4 | (0.0-15.7) | −4.97 | (−8.82; −0.95) |
| Tarragona | 52 | 20.5 | (14.9-26.0) | 31 | 8.8 | (5.7-11.9) | −5.02 | (−6.17; −3.85) |
| Teruel | 12 | 14.9 | (6.4-23.4) | 7 | 11.6 | (3.0-20.2) | −3.97 | (−6.49; −1.39) |
| Toledo | 30 | 12.5 | (8.0-17.0) | 20 | 7.3 | (4.1-10.5) | −5.28 | (−6.86; −3.67) |
| Valencia | 232 | 24.8 | (21.6-27.9) | 95 | 8.1 | (6.4-9.7) | −5.81 | (−6.36; −5.26) |
| Valladolid | 33 | 15.9 | (10.5-21.4) | 19 | 7 | (3.9-10.2) | −5.24 | (−7.00; −3.43) |
| Vizcaya | 86 | 16.6 | (13.1-20.1) | 49 | 8.1 | (5.8-10.4) | −3.84 | (−4.76; −2.92) |
| Zamora | 17 | 12.7 | (6.7-18.8) | 9 | 9.8 | (3.4-16.3) | −3.44 | (−5.50; −1.35) |
| Zaragoza | 65 | 15.8 | (12.0-19.7) | 39 | 8.5 | (5.8-11.1) | −4.21 | (−5.22; −3.19) |
95%CI, 95% confidence interval; AAMRs, age-adjusted mortality rates/100 000 population (direct method, European standard population for 2013); AAPC, average annual percent change estimated by Poisson models.
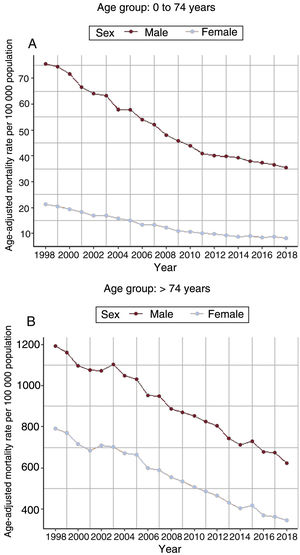
Figure 3 illustrates the national mortality trends from 1998 to 2018 in individuals younger and older than 74 years. For men and women younger than 74 years, the fall was uniform, with very small fluctuations. Although the magnitude was greater, the same pattern of reduced mortality was seen in those older than 74 years. The initial PM figures fell to practically half at the end of the study period. In addition, throughout the entire period, PM due to IHD in men was slightly more than 3 times that in women.
DISCUSSION and > 74 years (B).")
This study reveals a widespread decrease in the mean PM due to IHD from 1998 to 2018 at both the national and provincial levels that, on average, was more pronounced in women than in men (53% vs 61%). The geographical variations in the PM rates were heterogeneously distributed. The 3 regions exhibiting the greatest decrease in men were Lleida, Ceuta, and Toledo, whereas Palencia, Burgos, and Segovia showed the lowest decrease. In women, the 3 regions with the greatest decreases were Córdoba, Region of Murcia, and Barcelona; the lowest decreases were seen in Ceuta, León, and Palencia.
Our results are in agreement with those of the Spanish Health Information Institute (IIS),15 which covered the period from 1990 to 2006 and concluded that the ACs with the worst AAMRs are in the south (Andalusia, the Canary Islands, and the Autonomous Cities of Ceuta and Melilla) and the Valencian Community. The data are also in line with those reported by Boix et al.,17 who analyzed the period from 1988 to 1997 and the population aged between 35 and 64 years. The present study confirms that there was a reduction in mortality rates at the national level from 1998 to 2018, which is sustained17 and significant in all provinces and in both sexes. These results thus answer some of the questions raised by Boix et al.17 In addition, their results show that the north-south divide in Spain is maintained in the study period and they mention possible factors that could contribute to this heterogeneity,17 such as the geographical differences and the trends in the prevalence of cardiovascular risk factors (CVRFs), socioeconomic level, and health care quality and access. The results of the present study are also in line with the fall in acute myocardial infarction mortality observed by Dégano et al.,5 who estimated AAPC decreases of −4.4 and −7.3 in men and women in the province of Girona between 1985 and 2010, although the rates were calculated using a different methodology.
Differences among ACs have been found and analyzed in other studies, such as that by Banegas et al.2 in 2006, which also indicated that the geographical variability was similar to that seen in other cardiovascular diseases. Gómez-Martínez et al.,18 from 1999 to 2013, found a generalized mean decrease, both national and by AC, in PM due to heart failure in Spain that was also more pronounced in women than in men.
Progress has been made in the understanding of CVRFs in Spain in recent years.2,15–17,23,24 Modifiable CVRFs can be addressed in primary and secondary prevention. As shown in table 1, the pattern of the decline appears to be similar in age groups lower and higher than 74 years, indicating that there is no generational delay in the onset of fatal and nonfatal IHD events. The ERICE study,25 published in 2008, found that the major burden of CVRFs was present in the southeast and Mediterranean regions of Spain, with the lowest burden in the north and center. In 2010, the DARIOS study26 determined that the Canary Islands, Andalusia, and Extremadura had higher mortality due to IHD and higher prevalence of obesity, diabetes mellitus, hypertension, and dyslipidemia in both sexes. Recently, Orozco Beltrán et al.23 also found a heterogeneous geographical distribution, with excess mortality due to diabetes in southern and southeastern provinces. However, they also observed that the previous north-south divide ameliorated in 2008 and even disappeared in 2013, concluding that “these findings strengthen the hypothesis that the advances in primary, secondary, and tertiary prevention and the new drugs approved in these years have smoothened the mortality rates between patients with and without diabetes mellitus and that a higher prevalence would not necessarily equal higher mortality”.
Although the association between CVRFs and PM due to IHD does not allow us to make definitive conclusions and more studies are required, it seems reasonable to suppose that the worse behavior in the abovementioned regions is primarily due to their worse situation in terms of risk factors because there is no evidence that it can be attributed to other causes in this age group, such as differences in treatment or demographics.27
It is reasonable to attribute the observed behavior both to improvements in treatments and early diagnoses and to changes in the prevalence of risk factors, as has been postulated previously. Notably, the Infarction Code Program had not yet been implemented in most ACs in the period of this study, although catheterization units were operating in some hospitals. The implementation of the Infarction Code Program was recommended in 2009 in the Ischemic Heart Disease Strategy document of the Spanish National Health System28 and was introduced in the different ACs at different speeds.
Regardless, we consider it vital to continue investigating the regional differences in the trends in mortality due to IHD and in their causes to design and trial approaches aimed at reducing the incidence and lethality of this disease. All preventive measures to improve the control of CVRFs will culminate in additional improvements in the rates of mortality due to cardiovascular diseases and, consequently, of PM due to IHD.
LimitationsA possible limitation that would affect all studies of mortality would be related to the variability among regions in the coding of the basic cause of death, despite the application of standardized coding methods. The INE periodically reports the methodology and validity of the selection and grouping of the main causes of death. Spanish mortality data are treated and validated in the provincial delegations, in the different ACs, and in the central headquarters of the INE. This process can be consulted in the methodological reports of the INE.29 Regardless, there is no indication that these limitations would significantly affect the quality of the data and the results obtained from their analysis.
In addition, because the mortality data obtained from the INE do not provide individual data on CVRFs or on treatments or lifestyles, our analysis could not consider these variables. Accordingly, the reasons mentioned in the discussion of the present study to explain the observed mortality patterns were based on the literature consulted and were analyzed in the current work.
CONCLUSIONSBy analyzing the rate of PM due to IHD in the entire Spanish territory, our results show that there was a continued and marked tendency for a decrease in PM in both sexes during the study period. Both AAMRs of mortality and its variations were not homogeneous throughout the country but the heterogeneity was reduced at the end of the period, which suggests that the interprovincial differences are being dampened in recent years.
CONFLICTS OF INTERESTThe authors have no conflicts of interest to declare.
- -
Mortality due to IHD is very high. National AAMRs of mortality have decreased in men and women for several decades, although studies have not found significant differences at regional levels. A heterogeneous geographical distribution is evident, with higher mortality in southern and eastern Spain.
- -
The AAMRs of premature mortality continue to fall, significantly so in all provinces and in both sexes. The north-south divide is being softened, as in other studies of diabetes and CVRFs. The current data do not permit separate quantification of the effects of CVRF prevention, treatments, or implementation of the Infarction Code Program and catheterization units.
This study was supported by the Prometeo/2017/173 project of the Ministry of Education, Culture, and Sports of the Valencian Government.
Supplementary data associated with this article can be found in the online version available at https://doi.org/10.1016/j.rec.2020.09.034