
A new computed tomography-derived fractional flow reserve (CT-FFR) technique with a “coarse-to-fine subpixel” algorithm has been developed to generate precise lumen contours. The aim of this study was to assess the diagnostic performance of this new CT-FFR algorithm for discriminating lesion-specific ischemia using wire-based FFR ≤ 0.80 as the reference standard in patients with coronary artery disease.
MethodsThis prospective, multicenter study screened 330 patients undergoing coronary CT angiography (CCTA) and invasive FFR (median interval 2 days) from 6 tertiary hospitals. CT-FFR was evaluated in a blinded fashion with a “coarse-to-fine subpixel” algorithm for lumen contour.
ResultsBetween March 2019 and May 2020, we included 316 patients with 324 vessels. There was a good correlation between CT-FFR and invasive FFR (r=0.76, P<.001). The diagnostic sensitivity, specificity, and accuracy on a per-vessel level were 95.3%, 89.8%, and 92.0% for CT-FFR, and 96.4%, 26.4%, and 53.1% for CCTA>50% stenosis, respectively. CT-FFR showed improved discrimination of ischemia compared with CCTA alone overall (AUC, 0.95 vs 0.74, P<.001) and in intermediate (AUC, 0.96 vs 0.62, P<.001) and “gray zone” lesions (AUC, 0.88 vs 0.61, P<.001). The diagnostic specificity, accuracy, and AUC for CT-FFR (71.9%, 82.8%, and 0.84) outperformed CCTA (9.4%, 48.3%, and 0.66) in patients or in vessels with severe calcification (all P<.05).
ConclusionsCT-FFR with a new “coarse-to-fine subpixel” algorithm showed high performance in identifying hemodynamically significant stenosis. The diagnostic performance of CT-FFR was superior to that of CCTA in intermediate lesions, “gray zone” lesions, and severely calcified lesions.
Clinical Trial Register: NCT04731285
Keywords
Coronary computed tomography angiography (CCTA) is a noninvasive imaging modality that can identify or exclude anatomical stenoses in patients with suspected coronary artery disease.1,2 However, CCTA has only modest accuracy in predicting lesion-specific ischemia as measured by invasive fractional flow reserve (FFR), especially for intermediate and severely calcified lesions. The poor correlation between luminal stenosis and functional significance might lead to unnecessary invasive coronary angiography (ICA) and even revascularization.3
CCTA-derived FFR (CT-FFR) is a novel approach to identify hemodynamically significant coronary stenosis noninvasively. Methods based on computational fluid dynamics (CFD) and machine learning have been applied to compute CT-FFR that correlates well with invasive FFR and with improved performance compared with CCTA alone.4–10 Recently, a new CT-FFR technique with a “coarse-to-fine subpixel” algorithm (RuiXin-FFR, Raysight Medical, China) has been developed and could potentially generate precise lumen contours for CFD simulation, which might be more applicable in severely calcified lesions.
In this multicenter prospective study we evaluated the diagnostic performance of this new CT-FFR algorithm to detect functionally significant lesions using wire-based FFR as the reference method. We also compared the accuracy of CT-FFR vs CCTA alone to predict lesion-specific ischemia.
METHODSStudy design and populationThis multicenter, prospective cohort study (NCT04731285) was conducted at 6 tertiary hospitals in China. The study protocol was approved by the Ethics Committees of the Sixth Medical Center of PLA General Hospital, Wuhan University Renmin Hospital, Beijing Hospital, Beijing Anzhen Hospital, Capital Medical University, Zhongshan Hospital, Fudan University, and Liaoning Provincial People's Hospital. The investigation conformed to the principles outlined in the Declaration of Helsinki. All participants provided written informed consent.
Adult patients with suspected or known coronary artery disease were eligible for study inclusion. The inclusion criteria were as follows: a) age 18 years or older; b) angina or angina-equivalent symptoms; c) patients with an intermediate-to-high pretest probability of obstructive coronary artery disease; d) patients with a clinical indication for ICA (severe symptoms refractory to medical therapy, typical angina at a low level of exercise, clinical evaluation including exercise electrocardiograms indicating a high risk of events, and left ventricular dysfunction suggestive of coronary artery disease). Only patients who underwent CCTA as well as ICA and invasive FFR were enrolled. The main CCTA inclusion criteria were the presence of 1 or more lesions with 30% to 90% diameter stenosis and reference vessel size ≥ 2mm at the stenotic segment. Exclusion criteria included: a) prior percutaneous coronary intervention, coronary artery bypass surgery, heart valve surgery, cardiac pacemaker, or implanted cardiac defibrillator; b) unstable clinical conditions including cardiogenic shock, congestive heart failure (NYHA grade III or IV), or acute pulmonary edema; c) acute myocardial infarction within 1 week; d) other severe conditions including complex congenital heart disease, sick sinus syndrome, long QT syndrome, severe arrhythmia or tachycardia, severe asthma, severe chronic obstructive pulmonary disease, chronic renal impairment (creatinine clearance<45mL/min/1.73 m2), or noncardiac illness with life expectancy<2 years; e) allergy to iodine contrast agents or adenosine-5’-triphosphate; or f) pregnancy or pregnancy status unknown. The main CCTA exclusion criteria included misalignment artifacts and chronic total occlusion.
CCTA procedureAll CT scans were performed on ≥ 64 row detector CT scanners. The CCTA performance and interpretations were in accordance with the Society of Cardiovascular Computed Tomography guidelines with different computed tomography scanners at each site (Aquilion ONE, TOSHIBA, Japan; iCT 256, Philips, Netherlands; Optima CT680 Series/Revolution CT, GE MEDICAL SYSTEMS, United States; SOMATOM Definition/Definition Flash/Force, SIEMENS, Germany; uCT 960/960+, United Imaging Healthcare, China).11 The radiologists at each center followed the same CCTA scan imaging standard. In this standard, quantity was set according to patient weight and the contrast dose was 0.8∼0.9mL/kg, while the concentration was 350∼370mg/mL. Sublingual nitroglycerine was given in 258 (82%) patients, and beta-blockers were administered in 271 (86%) before CCTA scanning. The median interval between CCTA and ICA was 2 [IQR, 1-3] days. No serious adverse events occurred between CCTA tests and invasive FFR measurements. CCTAs were analyzed by experienced local investigators who were blinded to the wire-based FFR or CT-FFR values. Stenosis>50% on CCTA was considered significant.12 The stenoses were graded visually by experienced local investigators. Intermediate lesions were derived from CCTA measurements and defined as 30% to 70% stenosis.
CT-FFR performance and interpretationCT-FFR was analyzed in a blinded fashion by 2 experienced observers at an independent core laboratory (Yaping Zeng and Xiao Wang) using a dedicated off-site software system (RuiXin-FFR, version 1.0, Raysight Medical, China). The core laboratory indicated the location(s) of the wire-based FFR measurement(s) on a reconstructed coronary anatomy model. This process allows comparison of CT-FFR and invasive FFR at exactly the same locations.
Three-dimensional model reconstructionThree-dimensional anatomic models of the coronary tree were reconstructed from CCTA images. First, coarse segmentation of the coronary tree was performed using Frangifilter and largest connected component detection. Second, arterial centerlines were automatically extracted by regions growing from the previous coarse segmentation.13 Third, along the extracted centerlines, a new gradient-based method named “coarse-to-fine subpixel” algorithm was used to generate the lumen contours on the cross-sectional images. Finally, the surface model of the coronary tree was reconstructed by spline interpolation and lofting on all of the cross-sectional contours.
A new “coarse-to-fine subpixel” algorithm for lumen contourBecause pixel-level coarse coronary segmentation was insufficient for surface model reconstruction, a new “coarse-to-fine subpixel” algorithm for lumen contour was proposed to achieve more precise reconstructions. The details of this algorithm are shown in the Methods section of the supplementary data and figure 1 of the supplementary data. Briefly, we first extracted the cross-sectional image and computed its gradient map. Subpixel contours were computed based on Hounsfiled unit (HU) intensity and gradient. To obtain the lumen boundary, a curve fitting method was used to capture the closed contour in the high gradient region. The contour was further adaptively optimized both in the cross-sectional plane and along the axial direction where stenosis occurred or centerline curvature was large. The parameters of the algorithm were optimized and validated by comparison with ICA (data from another independent cohort) before this work (figure 2 of the supplementary data). Finally, precise lumen contours were generated at specified points along the coronary centerline (figure 1). The pixel size of each patient CCTA is range 0.3 ∼ 0.7mm determined by different reconstruction thickness. The HU intensity in the coronary lumen is range 200 ∼ 450 HU, and the computed gradient magnitude at each pixel is range 0 ∼ 1. The “coarse-to-fine subpixel” segmentation algorithm achieved subpixel accuracy and resulted a smoother model. The pixel-level segmentation results are not sufficiently smooth to accurately represent the real vessel lumen, which would lead to a higher pressure drop in CFD simulation. A comparison of reconstruction segmentation methods of different CT-FFR techniques is shown in table 1 of the supplementary data. A comparison of models reconstructed by pixel-level segmentation and “coarse-to-fine subpixel” segmentation is shown in figure 3 of the supplementary data.
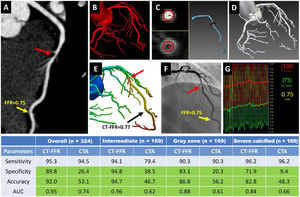
 CCTA demonstrates a noncalcified lesion with intermediate stenosis (60%) (red arrow) in the middle of LAD. (B-D) “coarse-to-fine subpixel” algorithm for geometric modeling: (B) initial voxel-level segmentation; (C) subpixel contours computed based on HU intensity and gradient, and artery model generated from contours; (D) the complete geometric model of the coronary tree. (E) CT-FFR computed from the geometric model using computational fluid dynamics, demonstrating obstructive stenosis (red arrow), with CT-FFR value=0.77. (F) invasive coronary angiogram showing intermediate stenosis in the middle of LAD (red arrow), and (G) confirmed as an obstructive stenosis by invasive FFR value of 0.75 (yellow arrow). CT-FFR showed improved specificity, accuracy, and AUC compared with CCTA alone overall and in intermediate, “gray zone”, and severely calcified lesions on a per-vessel level (table). Cell in light green indicates significant difference between CT-FFR and CCTA (P<.05). AUC, area under the receiver-operator characteristics curve; CCTA, coronary computed tomography angiography; CT-FFR, computed tomography angiography-derived fractional flow ratio; FFR, fractional flow reserve; LAD, left anterior descending.")
Central illustration. Representative case and diagnostic performance of Ruixin CT-FFR with a new “coarse-to-fine subpixel” algorithm in discriminating functional stenosis. (A) CCTA demonstrates a noncalcified lesion with intermediate stenosis (60%) (red arrow) in the middle of LAD. (B-D) “coarse-to-fine subpixel” algorithm for geometric modeling: (B) initial voxel-level segmentation; (C) subpixel contours computed based on HU intensity and gradient, and artery model generated from contours; (D) the complete geometric model of the coronary tree. (E) CT-FFR computed from the geometric model using computational fluid dynamics, demonstrating obstructive stenosis (red arrow), with CT-FFR value=0.77. (F) invasive coronary angiogram showing intermediate stenosis in the middle of LAD (red arrow), and (G) confirmed as an obstructive stenosis by invasive FFR value of 0.75 (yellow arrow).
CT-FFR showed improved specificity, accuracy, and AUC compared with CCTA alone overall and in intermediate, “gray zone”, and severely calcified lesions on a per-vessel level (table). Cell in light green indicates significant difference between CT-FFR and CCTA (P<.05).
AUC, area under the receiver-operator characteristics curve; CCTA, coronary computed tomography angiography; CT-FFR, computed tomography angiography-derived fractional flow ratio; FFR, fractional flow reserve; LAD, left anterior descending.
Patient-specific data, such as the volume of left ventricular myocardium, was also generated from the CCTA images. Flow distribution among the left anterior descending, left circumflex and right coronary arteries was determined by the number and outlet area of branches in the anatomic model. To calculate the total coronary flow rate at hyperemia for CT-FFR, the total coronary flow rate at rest was multiplied by a constant coefficient. Blood was modeled as a Newtonian fluid. Incompressible Navier-Stokes equations were solved with a finite element method. Finally, CT-FFR values were obtained from the CFD solution. CT-FFR ≤ 0.80 was considered hemodynamically significant.
Invasive FFR measurementPressure wire-based FFR was acquired using a commercially available system by operators blinded to the CT-FFR results according to standard performance during maximal hyperemia, induced by administration of intravenous or intracoronary adenosine,14 depending on the operator's choice. Before the measurement, equalization of the pressure wire and the aortic pressure was performed at the tip of the guide catheter. At the end of the procedure, a drift check was performed by bringing the pressure wire back to the guide catheter at the same location as the initial equalization. Differences>3mmHg between the pressure wire and the guide catheter indicated failure in measurement and another attempt was performed. The FFR was considered functionally significant at a threshold of ≤ 0.80 on a per-patient and per-vessel basis. FFR between 0.75 and 0.85 was defined as the “gray zone”.15
Study endpointsThe coprimary endpoints were the sensitivity and specificity of CT-FFR in predicting hemodynamically significant coronary stenosis with wire-based FFR ≤ 0.80. Major secondary endpoints were the diagnostic accuracy, positive predictive value, negative predictive value (NPV), area under the receiver-operating characteristic curve (AUC) of CT-FFR, and its correlation with FFR. The diagnostic performance of CT-FFR vs CCTA was also compared.
Sample size calculation and statistical analysesThe assumptions were made to meet the performance goals for the coprimary end points: CT-FFR sensitivity=90% and CT-FFR specificity=70%. The corresponding target values for sensitivity and specificity were set as 80% and 60%, respectively. With an assumed prevalence of positive FFR as 33% to 50%, type I error (α)=0.025 (1-sided), statistical power (1 – β)=80%, and 10% data loss, a total of 330 patients were needed for this study.
Continuous data are presented as mean±standard deviation (SD) or median [interquartile range], as appropriate. Binary variables were presented as number and percentages (%). The chi-square test was used for categorical variables. Diagnostic measures including sensitivity, specificity, accuracy, positive predictive value, and NPV on a per-patient or per-vessel level were calculated for CT-FFR and CCTA and were compared with the McNemar test. The AUCs derived from receiver-operating characteristic curves were calculated for CT-FFR using invasive FFR ≤ 0.80 as the reference standard and were compared with CCTA by the DeLong test. Diagnostic performance was also evaluated in subgroups including patients and vessels with intermediate lesions (30%-70% CCTA stenosis), calcified (Agatston calcium scores>0) or severely calcified lesions (Agatston calcium scores ≥ 400), and FFR “gray zone” lesions (0.75 ≤ FFR ≤ 0.85). Pearson correlation coefficients were calculated to determine the relationship between CT-FFR and invasive FFR. Bland-Altman analysis was performed to analyze the agreement of CT-FFR with invasive FFR. Intraclass correlation coefficients for single measures were used to assess the interobserver and intraobserver agreement of CT-FFR value with 95% confidence intervals (30 randomly selected vessels). A 2-sided P value of<.05 was considered to indicate statistical significance. All analyses were performed with SAS Proprietary Software (version 9.4, SAS Institute, United States).
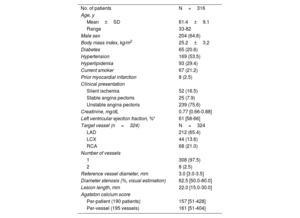
RESULTSPatient and lesion characteristicsBetween March 2019 and May 2020, a total of 330 patients were screened. Fourteen patients were excluded due to A prior implanted cardiac defibrillator (n=1), congestive heart failure (NYHA grade III), and inability to perform FFR measurement (n=12). Finally, 316 patients with 324 vessels were analyzed (figure 4 of the supplementary data). Baseline characteristics are described in table 1. The mean age was 61.4±9.1 years, 204 patients (64.6%) were men, and 65 (20.6%) had diabetes mellitus. Based on invasive FFR ≤ 0.80, 126 patients (39.9%) and 127 vessels (39.2%) had lesions that were considered hemodynamically significant. There were 139 patients (44.0%) with CT-FFR ≤ 0.80, 214 (67.7%) with>50% stenosis on ICA, 212 (67.1%) with>50% stenosis on CCTA, and 164 (51.9%) with intermediate stenoses, respectively.
Baseline Characteristics
| No. of patients | N=316 |
| Age, y | |
| Mean±SD | 61.4±9.1 |
| Range | 33-82 |
| Male sex | 204 (64.6) |
| Body mass index, kg/m2 | 25.2±3.2 |
| Diabetes | 65 (20.6) |
| Hypertension | 169 (53.5) |
| Hyperlipidemia | 93 (29.4) |
| Current smoker | 67 (21.2) |
| Prior myocardial infarction | 8 (2.5) |
| Clinical presentation | |
| Silent ischemia | 52 (16.5) |
| Stable angina pectoris | 25 (7.9) |
| Unstable angina pectoris | 239 (75.6) |
| Creatinine, mg/dL | 0.77 [0.66-0.88] |
| Left ventricular ejection fraction, %* | 61 [58-66] |
| Target vessel (n=324) | N=324 |
| LAD | 212 (65.4) |
| LCX | 44 (13.6) |
| RCA | 68 (21.0) |
| Number of vessels | |
| 1 | 308 (97.5) |
| 2 | 8 (2.5) |
| Reference vessel diameter, mm | 3.0 [3.0-3.5] |
| Diameter stenosis (%, visual estimation) | 62.5 [50.0-80.0] |
| Lesion length, mm | 22.0 [15.0-30.0] |
| Agatston calcium score | |
| Per-patient (190 patients) | 157 [51-428] |
| Per-vessel (195 vessels) | 161 [51-404] |
LAD, left anterior descending; LCX, left circumflex; RCA, right coronary artery.
Values are expressed as mean±standard deviation, median [interquartile range], or No. (%).
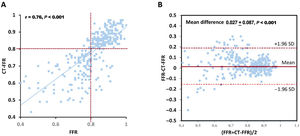
On a per-vessel basis the median invasive FFR was 0.84 [0.76-0.90], and the median CT-FFR was 0.83 [0.70-0.87]. There was a good correlation between continuous variables of CT-FFR and invasive FFR (r=0.76, P<.001) on a per-vessel level (figure 2A) as well as good agreement (mean difference 0.027±0.087, 95% limits of agreement:−0.144 to 0.198) (figure 2B). The interobserver and intraobserver agreement of CT-FFR was 0.92 (95%CI, 0.83-0.96) and 0.91 (95%CI, 0.82-0.96), respectively.
 Correlation scatter plot with linear regression, r=0.76. (B) Bland-Altman plot with 95% confidence limits between−0.144 and 0.198 for absolute differences. The mean difference is shown as a solid red line, and dotted lines indicate the corresponding limits of agreement. CT-FFR, computed tomography angiography-derived fractional flow ratio; FFR, fractional flow reserve.")
Correlation between CT-FFR and invasive FFR and Bland-Altman plot on a per-vessel level. (A) Correlation scatter plot with linear regression, r=0.76. (B) Bland-Altman plot with 95% confidence limits between−0.144 and 0.198 for absolute differences. The mean difference is shown as a solid red line, and dotted lines indicate the corresponding limits of agreement. CT-FFR, computed tomography angiography-derived fractional flow ratio; FFR, fractional flow reserve.
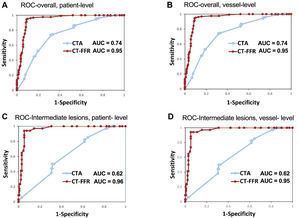
Compared with invasive FFR ≤0.80, the sensitivity, specificity, positive predictive value, NPV, and accuracy of CT-FFR ≤ 0.80 were 95.2%, 90.0%, 86.3%, 96.6%, and 92.1%, respectively, on a per-patient basis and 95.3%, 89.8%, 85.8%, 96.7%, and 92.0%, respectively, on a per-vessel basis. On both a per-patient and per-vessel level, CT-FFR ≤ 0.80 significantly improved specificity, positive predictive value, NPV, and accuracy compared with CCTA>50% stenosis (table 2). The AUC for CT-FFR ≤ 0.80 (0.95; 95%CI, 0.92-0.97) exceeded that of visually classified CCTA>50% stenosis (0.74; 95%CI, 0.69-0.79) on a per-patient level (all P<.001) (table 2, figure 3A,B). These findings were also consistent in patients with intermediate lesions (table 2, figure 3C,D). Interestingly, all vessels were diagnosed correctly by CT-FFR when invasive FFR was<0.75. When invasive FFR was>0.85 or<0.75, 193 out of 203 stenotic lesions were diagnosed correctly (figure 5 of the supplementary data).
Diagnostic performance of CT-FFR and CCTA vs invasive FFR, overall and among patients and vessels with a lesion of intermediate severity
| Overall | Per-patient (n=316) | Per-vessel (n=324) | ||||
|---|---|---|---|---|---|---|
| CT-FFR ≤ 0.80 | CCTA>50% | P* | CT-FFR ≤ 0.80 | CCTA>50% | P* | |
| TP/FN/FP/TN, No. | 120/6/19/171 | 119/7/140/50 | - | 121/6/20/177 | 120/7/145/52 | - |
| Sensitivity, % | 95.2 (89.9-98.2) | 94.4 (88.9-97.7) | .999 | 95.3 (90.0-98.2) | 94.5 (89.0-97.8) | .999 |
| Specificity, % | 90.0 (84.8-93.9) | 26.3 (20.2-33.2) | <.001 | 89.8 (84.8-93.7) | 26.4 (20.4-33.1) | <.001 |
| PPV, % | 86.3 (79.5-91.6) | 45.9 (39.8-52.2) | <.001 | 85.8 (78.9-91.1) | 45.3 (39.2-51.5) | <.001 |
| NPV, % | 96.6 (92.8-98.7) | 87.7 (76.3-94.9) | .01 | 96.7 (93.0-98.8) | 88.1 (77.1-95.1) | .01 |
| Accuracy, % | 92.1 (88.5-94.8) | 53.5 (47.8-59.1) | <.001 | 92.0 (88.5-94.7) | 53.1 (47.5-58.6) | <.001 |
| AUC, % | 0.95 (0.92-0.97) | 0.74 (0.69-0.79) | <.001 | 0.95 (0.92-0.97) | 0.74 (0.69-0.79) | <.001 |
| Intermediate lesions | Per-patient (n=164) | Per-vessel (n=169) | ||||
|---|---|---|---|---|---|---|
| CT-FFR ≤ 0.80 | CCTA>50% | P* | CT-FFR ≤ 0.80 | CCTA>50% | P* | |
| TP/FN/FP/TN, n | 32/2/7/123 | 27/7/80/50 | - | 32/2/7/128 | 27/7/83/52 | - |
| Sensitivity, % | 94.1 (80.3-99.3) | 79.4 (62.1-91.3) | .18 | 94.1 (80.3-99.3) | 79.4 (62.1-91.3) | .18 |
| Specificity, % | 94.6 (89.2-97.8) | 38.5 (30.1-47.4) | <.001 | 94.8 (89.6-97.9) | 38.5 (30.3-47.3) | <.001 |
| PPV, % | 82.1 (66.5-92.5) | 25.2 (17.3-34.6) | <.001 | 82.1 (66.5-92.5) | 24.5 (16.8-33.7) | <.001 |
| NPV, % | 98.4 (94.3-99.8) | 87.7 (76.3-94.9) | .002 | 98.5 (94.6-99.8) | 88.1 (77.1-95.1) | .002 |
| Accuracy, % | 94.5 (89.8-97.5) | 47.0 (39.1-54.9) | <.001 | 94.7 (90.1-97.5) | 46.7 (39.0-54.6) | <.001 |
| AUC | 0.96 (0.92-0.99) | 0.62 (0.54-0.70) | <.001 | 0.96 (0.92-0.99) | 0.62 (0.55-0.70) | <.001 |
AUC, area under the receiver-operating characteristic curve; CCTA, coronary computed tomography angiography; CT-FFR, computed tomography angiography-derived fractional flow ratio; NPV, negative predictive value; PPV, positive predictive value; TP, true positives; FN, false negatives; FP, false positives; TN, true negatives.
 in all patients (A, B) and patients with intermediate lesions (C, D) on a per-patient (A, C) and per-vessel level (B, D). AUC, area under the receiver-operating characteristics curve; CCTA, coronary computed tomography angiography; CT-FFR, computed tomography angiography-derived fractional flow ratio; ROC, receiver-operating characteristic.")
ROC curve and AUC of CT-FFR vs CCTA for detecting the functional significant ischemia (invasive FFR ≤ 0.8) in all patients (A, B) and patients with intermediate lesions (C, D) on a per-patient (A, C) and per-vessel level (B, D). AUC, area under the receiver-operating characteristics curve; CCTA, coronary computed tomography angiography; CT-FFR, computed tomography angiography-derived fractional flow ratio; ROC, receiver-operating characteristic.
The median Agatston score (190 patients, 195 vessels) was 157 [51-428] per patient and 161 [51-404] per vessel. Agatston score ≥ 400 was found in 30.5% on a patient level and 29.7% on a vessel level. The diagnostic specificity, accuracy, and AUC for CT-FFR ≤ 0.80 on a per-vessel basis (87.1%, 90.3%, and 0.95) outperformed CCTA>50% stenosis (21.8%, 48.7%, and 0.74) (all P<.001). This was especially true in patients with severely calcified lesions. No significant difference was observed in sensitivity and NPV between CT-FFR ≤ 0.80 and CCTA>50% stenosis (table 3). A representative case is shown in figure 6 of the supplementary data.
Diagnostic performance of CT-FFR and CCTA vs invasive FFR among patients and vessels with calcified lesions
| Calcified lesionsa(calcium score>0) | Per-patient (n=190) | Per-vessel (n=195) | ||||
|---|---|---|---|---|---|---|
| CT-FFR ≤ 0.80 | CCTA>50% | Pb | CT-FFR ≤ 0.80 | CCTA>50% | Pb | |
| TP/FN/FP/TN, n | 68/3/15/104 | 68/3/93/26 | - | 68/3/16/108 | 68/3/97/27 | - |
| Sensitivity, % | 95.8 (88.1-99.1) | 95.8 (88.1-99.1) | .999 | 95.8 (88.1-99.1) | 95.8 (88.1-99.1) | .999 |
| Specificity, % | 87.4 (80.1-92.8) | 21.8 (14.8-30.4) | <.001 | 87.1 (79.9-92.4) | 21.8 (14.9-30.1) | <.001 |
| PPV, % | 81.9 (72.0-89.5) | 42.2 (34.5-50.3) | <.001 | 81.0 (70.9-88.7) | 41.2 (33.6-49.1) | <.001 |
| NPV, % | 97.2 (92.0-99.4) | 89.7 (72.6-97.8) | .08 | 97.3 (92.3-99.4) | 90.0 (73.5-97.9) | .08 |
| Accuracy, % | 90.5 (85.4-94.3) | 49.5 (42.2-56.8) | <.001 | 90.3 (85.2-94.0) | 48.7 (41.5-56.0) | <.001 |
| AUC | 0.94 (0.89-0.97) | 0.73 (0.66-0.79) | <.001 | 0.95 (0.89-0.97) | 0.74 (0.67-0.80) | <.001 |
| Severe calcified lesions(calcium score ≥ 400) | Per-patient (n=58) | Per-vessel (n=58) | ||||
|---|---|---|---|---|---|---|
| CT-FFR ≤ 0.80 | CCTA>50% | Pb | CT-FFR ≤ 0.80 | CCTA>50% | Pb | |
| TP/FN/FP/TN, n | 25/1/9/23 | 25/1/29/3 | - | 25/1/9/23 | 25/1/29/3 | - |
| Sensitivity, % | 96.2 (80.4-99.9) | 96.2 (80.4-99.9) | .999 | 96.2 (80.4-99.9) | 96.2 (80.4-99.9) | .999 |
| Specificity, % | 71.9 (53.3-86.3) | 9.4 (2.0-25.0) | <.001 | 71.9 (53.3-86.3) | 9.4 (2.0-25.0) | <.001 |
| PPV, % | 73.5 (55.6-87.1) | 46.3 (32.6-60.4) | .01 | 73.5 (55.6-87.1) | 46.3 (32.6-60.4) | .01 |
| NPV, % | 95.8 (78.9-99.9) | 75.0 (19.4-99.4) | .14 | 95.8 (78.9-99.9) | 75.0 (19.4-99.4) | .14 |
| Accuracy, % | 82.8 (70.6-91.4) | 48.3 (35.0-61.8) | <.001 | 82.8 (70.6-91.4) | 48.3 (35.0-61.8) | <.001 |
| AUC | 0.84 (0.72-0.92) | 0.66 (0.52-0.78) | .03 | 0.84 (0.72-0.92) | 0.66 (0.52-0.78) | .03 |
AUC, area under the receiver-operating characteristic curve; CCTA, coronary computed tomography angiography; CT-FFR, computed tomography angiography-based fractional flow ratio; NPV, negative predictive value; PPV, positive predictive value; TP, true positives; FN, false negatives; FP, false positives; TN, true negatives.
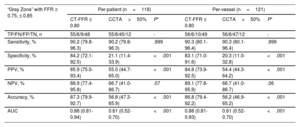
In 118 (36.4%) vessels with “gray zone” lesions (invasive FFR 0.75-0.85), the diagnostic specificity, accuracy, and AUC remained high for CT-FFR ≤ 0.80 on a per-vessel basis (83.1%, 86.8%, and 0.88), outperforming CCTA>50% stenosis (20.3%, 56.2%, 0.61) (all P<.001) (table 4). All 6 “false negative” vessels where CT-FFR did not identify ischemia had invasive FFR values between 0.75 and 0.80 (figure 5 of the supplementary data).
Diagnostic performance of CT-FFR and CCTA vs invasive FFR among patients and vessels with “gray zone” lesions
| “Gray Zone” with FFR ≥ 0.75, ≤ 0.85 | Per-patient (n=118) | Per-vessel (n=121) | ||||
|---|---|---|---|---|---|---|
| CT-FFR ≤ 0.80 | CCTA>50% | P* | CT-FFR ≤ 0.80 | CCTA>50% | P* | |
| TP/FN/FP/TN, n | 55/6/9/48 | 55/6/45/12 | - | 56/6/10/49 | 56/6/47/12 | - |
| Sensitivity, % | 90.2 (79.8-96.3) | 90.2 (79.8-96.3) | .999 | 90.3 (80.1-96.4) | 90.3 (80.1-96.4) | .999 |
| Specificity, % | 84.2 (72.1-92.5) | 21.1 (11.4-33.9) | <.001 | 83.1 (71.0-91.6) | 20.3 (11.0-32.8) | <.001 |
| PPV, % | 85.9 (75.0-93.4) | 55.0 (44.7-65.0) | <.001 | 84.8 (73.9-92.5) | 54.4 (44.3-64.2) | <.001 |
| NPV, % | 88.9 (77.4-95.8) | 66.7 (41.0-86.7) | .07 | 89.1 (77.8-95.9) | 66.7 (41.0-86.7) | .06 |
| Accuracy, % | 87.3 (79.9-92.7) | 56.8 (47.3-65.9) | <.001 | 86.8 (79.4-92.2) | 56.2 (46.9-65.2) | <.001 |
| AUC | 0.88 (0.81-0.94) | 0.61 (0.52-0.70) | <.001 | 0.88 (0.81-0.93) | 0.61 (0.52-0.70) | <.001 |
AUC, area under the receiver-operating characteristic curve; CCTA, coronary computed tomography angiography; CT-FFR, computed tomography angiography-based fractional flow ratio; NPV, negative predictive value; PPV, positive predictive value; TP, true positives; FN, false negatives; FP, false positives; TN, true negatives.
In this prospective multicenter study, we demonstrated the good diagnostic performance of CT-FFR with a new “coarse-to-fine subpixel” algorithm for detecting hemodynamically significant stenosis. The overall diagnostic sensitivity, specificity, and accuracy were high (all>89%) compared with invasive FFR, exceeding the prespecified performance goal. Specifically, the diagnostic performance of CT-FFR was superior to CCTA stenosis detection in a variety of lesion types including intermediate, “gray zone”, and severely calcified lesions.
Anatomic stenosis based on CCTA or angiography shows a poor correlation with the presence of hemodynamically significant ischemia.3,16 FFR has emerged as the gold-standard for determining lesion-specific ischemia and guiding coronary revascularization,17–19 but is inherently limited by its invasiveness and costs. Several CFD-based or machine learning-based noninvasive CT-FFR algorithms have been developed in the past decade,4–10 including 2 Chinese products named uCT-FFR and CT-QFR.4,5 Compared with previous studies, the present study showed notably higher sensitivity (95%), specificity (90%), and accuracy (92%) for detecting lesion-specific ischemia. More than half (171/316) of the patients were judged correctly as having no obstructive lesions by CT-FFR with FFR as the reference standard. In addition, CT-FFR successfully identified one-third (120/316) of the patients with functional ischemia who would probably benefit from revascularization. This was true for patients with intermediate lesions. Although the presence of “gray zone” lesions negatively affected the performance of CT-FFR, it still significantly outperformed CCTA alone in the diagnosis of ischemia (AUC, 0.88 vs 0.61).
Calcified lesions are a diagnostic challenge for CCTA and are the most common cause of false-positive results compared with ICA.20 Severe coronary calcification affects segmentation of the vessel lumen and boundary conditions for physiological modeling, impairing the diagnostic performance of CT-FFR.21 In the present study, the diagnostic specificity and accuracy of CT-FFR were significantly higher than that of CCTA in calcified lesions and lesions with Agatston score ≥ 400 (all P<.001) with similar sensitivity. In severely calcified lesions (30% of patients), CT-FFR showed improved discrimination of ischemia compared with CCTA alone on both per-patient (P=.03) and per-vessel levels (P=.03), a similar finding also observed in recent reports4,6,21–23 highlighting the promising potential for wide clinical application.
Of note, the good diagnostic performance of CT-FFR might be attributed to the new technique of lumen contour “coarse-to-fine subpixel” algorithm. Table 1 of the supplementary data provides a comparison of the various CT-FFR reconstruction segmentation approaches. The reconstruction method of HeartFlow (FFRct) and United Imaging (uCT-FFR) are both in pixel-level. They use the classic image processing algorithms and convolutional neural network algorithm, respectively. Toshiba CT-FFR has to be reconstructed by 4 phases (70%, 80%, 90%, and 99% of R-R interval) of CCTA images. Siemens cFFR abstracts the coronary 3D geometry by 1D feature vectors and then predicts CT-FFR by a trained machine learning model. Although its prediction speed is fast, the abstract feature vectors lose the abundant 3D information and lead to a decrease in accuracy. Our proposed technique computed subpixel level lumen contour, generating the artery centerline after the first coarse coronary segmentation on a pixel level. The new technology led to more precise lumen boundary and vessel reconstructions and substantially improved diagnostic performance. A second explanation was strict adherence to guideline and recommendation for CCTA acquisition and imaging quality control, especially for heart rate control (86% of patients with beta-blockers prescan) and sublingual nitrate administration (82% of patients). The latter has been demonstrated to correlate with CCTA quality, CFD simulation, and diagnostic performance.11 Finally, the median interval of 2 days between CCTA acquisition and invasive FFR was shorter than in the NXT study (mean 18 days) and a Chinese retrospective study (3 months),4,8 and was similar to DISCOVER-FLOW (Diagnosis of Ischemia-Causing Stenoses Obtained Via Noninvasive Fractional Flow Reserve, 2.3 days with a wide range of 0 to 26 days),10 which may have contributed to the consistency of diagnostic accuracy.
LimitationsIn this study, not all vessels were interrogated for all enrolled patients. Vessels with a stenosis diameter<30% or>90% were not assessed. Patients with a prior percutaneous coronary intervention or coronary artery bypass grafting were excluded. The administration of sublingual nitroglycerin or beta-blockers was not consistent among patients and the rate of use of sublingual nitroglycerin was relatively low compared with that in other reports.8,11 Consequently, we conducted a subanalysis, revealing consistent diagnostic accuracy between patients with and without use of nitroglycerin (91.9% vs 93.1%, P=.96). In the present study, clinical presentation was unstable angina in most of the patients and there were no patients with 3-vessel or left main disease, indicating potential selection bias. Further studies are needed to validate this new technique in a broader population. Compared with other studies,9,22 the patients enrolled in this study had relatively low coronary calcification. As coronary calcification would affect the diagnostic accuracy of CT-FFR, we performed a subgroup analysis and found consistent results in patients with severe calcification (table 3). Furthermore, there was no direct comparison between the coarse-to-fine subpixel CT-FFR algorithm and other CT-based FFR algorithms. This study did not take into account the multitude of artifacts, including calcium, patients’ movements, and misregistration, which can impact the diagnostic performance of CCTA. Finally, the prognostic and socioeconomic value of this noninvasive CT-FFR in domestic medical systems require further study.
CONCLUSIONSIn this prospective multicenter study, CT-FFR with a new “coarse-to-fine subpixel” algorithm showed higher diagnostic specificity and accuracy than CCTA alone. This new technique has the potential to discriminate hemodynamically significant stenosis in a variety of lesion types including intermediate, “gray zone”, and severely calcified lesions.
A new CT-FFR technique with a “coarse-to-fine subpixel” algorithm has been developed to generate precise lumen contours for CFD simulation, but its diagnostic performance remains uncertain.
WHAT DOES THIS STUDY ADD?This multicenter prospective study demonstrates that this new CT-FFR algorithm provided good diagnostic performance for detecting hemodynamically significant stenosis. The overall diagnostic sensitivity, specificity, and accuracy were high (all>89%) compared with invasive FFR. The diagnostic performance of CT-FFR was superior to detection of stenosis by CCTA in a variety of lesion types including intermediate, “gray zone”, and severely calcified lesions.
This work was funded by grants from the National Key R&D Program of China (2022YFC2505600, 2020YFC2004800), the Beijing Nova Program (Z201100006820087), and the Interdisciplinary Cooperation Project of Beijing Nova Program (Z211100002121165).
AUTHORS’ CONTRIBUTIONSStudy concept and design: Z. Li and S. Nie. Acquisition, analysis, or interpretation of data: Y. Zeng, X. Wang, Z. Tang, T. Li, X. Jiang, F. Ji, Y. Zhou, J. Ge, Z. Li, and S. Nie. Drafting of the manuscript: Y. Zeng and X. Wang. Statistical review of the manuscript: Y. Zhao. Critical revision of the manuscript for important intellectual content: C. Ma, G.S. Mintz, and S. Nie. All authors read and approved the final manuscript.
CONFLICTS OF INTERESTC. Ma: honoraria from Bristol-Myers Squibb, Pfizer, Johnson & Johnson, Boehringer-Ingelheim (BI), Bayer and AstraZeneca for giving lectures. G.S. Mintz: honoraria from Boston Scientific, Philips, and Terumo. S. Nie: research grants to the institution from Boston Scientific, Abbott, Jiangsu Hengrui Pharmaceuticals, China Resources Sanjiu Medical & Pharmaceuticals, East China Pharmaceuticals. The remaining authors have no relevant relationships to disclose.