
Despite medical advances, mortality after ST-elevation myocardial infarction (STEMI) remains high. Women are often underrepresented in trials and registries, limiting knowledge of their management and prognosis. It is unknown whether life expectancy in women of all ages treated with primary percutaneous coronary intervention (PPCI) is similar to that in a reference population free of the disease. The main objective of this study was to determine whether life expectancy in women undergoing PPCI and surviving the main event returns to a similar level to that in the general population of the same age and region.
MethodsWe included all patients diagnosed with STEMI from January 2014 to October 2021. We matched women to a reference population of the same age and region from the National Institute of Statistics to determine observed survival, expected survival, and excess mortality (EM) using the Ederer II method. We repeated the analysis in women aged ≤ 65 and> 65 years.
ResultsA total of 2194 patients were recruited, of whom 528 were women (23.9%). In women surviving the first 30 days, EM at 1, 5 and 7 years was 1.6% (95%CI, 0.3-4), 4.7% (95%CI, 0.3-10.1), and 7.2% (95%CI, 0.5-15.1), respectively.
ConclusionsEM was reduced in women with STEMI who were treated with PPCI and who survived the main event. However, life expectancy remained lower than that in a reference population of the same age and region.
Keywords
Cardiovascular disease is the leading cause of death worldwide, accounting for over 18 million deaths yearly.1 The prevalence of this disease is increasing in women, and acute coronary syndromes account for most cardiovascular deaths, with a prevalence of up to 3 million cases.2
Mortality from ST-elevation myocardial infarction (STEMI) has decreased over the past few years due to improvements in medical therapies, secondary prevention measures, and—in particular—emergent reperfusion therapies, in which primary percutaneous coronary intervention (PCI) is the cornerstone of treatment.3 However, mortality remains as high as 6% in the first 30 days and 9% after 1 year in the past decade.4
Although STEMI mainly affects men, mortality does not affect the population equally, with higher rates during the first year in women and older individuals. However, after 1 year of follow-up, the findings are contradictory. Women usually develop cardiovascular disease 10 years later than men and are prone to having more comorbidities. Therefore, although crude mortality is higher in women after 1 year, it tends to converge with that of men when adjusted by age and risk factors.5 Furthermore, women tend to have atypical presentations and consult later than men, hampering the diagnostic process and leading to delays in the acute care of STEMI and lower use of primary PCI.6
Although primary PCI is a well-adopted technique, studies evaluating prognosis compared with that in the general population are sparse, especially in younger participants. Additionally, 1-year survival is primarily determined by mortality within the initial 30 days (ie, acute event) and studies rarely follow patients up after this period.7
A study of the impact on life expectancy recovery after mid-term follow-up in women aged ≥ 75 years compared with the general population of the same age and geographic area undergoing primary PCI showed that survival in 30-day survivors of the main event was similar to that in the general population.8 However, the analysis did not include the whole age spectrum. Since mortality is higher in older adults, these results cannot be extrapolated or taken to indicate that life expectancy in younger women returns to similar levels.
For this reason, the main objective of the present study was to determine whether life expectancy in women of all ages experiencing a STEMI and treated with primary PCI returns to a similar level to that in the general population of the same age and geographic area after long-term follow-up, if they survive the acute event.
METHODSStudy designThis retrospective observational study recruited all consecutive patients diagnosed with STEMI and treated with a primary PCI in our center from January 2014 to October 2021. Our center is the referral hospital for a population of 1 million inhabitants. Our team has more than 10 years’ experience and treats more than 250 patients annually. Exclusion criteria were age <18 years and fibrinolysis treatment.
We constructed the reference population using mortality tables provided by the National Institute of Statistics of Spain (Instituto National de Estadística [INE]). This institute publishes mortality data stratified by age ranges, sex, and autonomous regions in Spain on its official website. To compare our sample of patients with STEMI with the reference population, we matched our data with the mortality tables provided by the INE with participants of the same age, sex, geographical area, and year of the event. All participants were followed up for at least 1 year after the main event and the study ended in October 2022.9
Data collection and follow-upData on baseline characteristics, procedure, hospitalization, and discharge were obtained from a prospectively collected STEMI database. The follow-up data to confirm if patients were alive and the causes of death were collected from electronic medical records and telephone interviews. All the hospitals in our regions are connected through an intranet, and all data are readily available for consultation.
Patient treatment during admission and optimal medical therapy at discharge were selected following the latest European Society of Cardiology guidelines. Standardized endpoints and causes of death were defined according to the Academic Research Consortium-2 consensus document.10
As a convention, most studies and clinical guidelines issued by European and American societies refer to elderly patients as those older than 65 years.11,12 Because our sample was similarly divided at this age and had a sufficient number of events to power this study, we separated participants into 2 groups: a) women aged ≤ 65 years, and b) women aged> 65 years.
Primary endpointsTo compare survival in women with STEMI treated with primary PCI with that in the general population of the same age and geographical region surviving the first 30 days.
Secondary endpoints- a)
To compare survival in women aged ≤ 65 years with STEMI treated with primary PCI and surviving the first 30 days with that in the general population of the same age and geographical region.
- b)
To compare survival in women aged> 65 years with STEMI treated with primary PCI and surviving the first 30 days with that in the general population of the same age and geographical region.
Quantitative variables are expressed as mean±standard deviation or median [interquartile range] and were compared using the Student t test and Wilcoxon rank test, respectively. Categorical variables are expressed as numbers (percentages) and were compared using the chi-square test and, if there were several categories, the ANOVA test.
We performed a multivariable Cox regression analysis to determine the factors that predicted mortality. The variables introduced were defined using backward stepwise elimination with a cutoff of P <.10. Associations are expressed as hazard ratios (HR) with 95% confidence intervals (95%CI). The predictive capacity of the model was evaluated with the Harrel c test and survival was assessed using Kaplan-Meier curves. Statistical significance was set at P <.05.
To compare women with STEMI undergoing primary PCI with the general population of the same age and geographical area, we made the following estimates:
- 1.
Observed survival (OS): this is the probability of surviving all causes of death in the group of women undergoing primary PCI, and is estimated using the life table method. OS is represented with a 95%CI.
- 2.
Expected survival (ES): The survival probability of a population similar to the study sample but free from the underlying disease (STEMI in this case). In other words, ES represents the expected mortality of individuals in this sample if they had not had STEMI. In this case, we obtained the data from the INE, which provided mortality tables from individuals of the same age and geographical region. Since the entire population of the region is included, ES had no sampling error and therefore no confidence intervals were estimated.9 The Ederer II method works under the assumption that when ES is modeled, deaths from a specific cause like STEMI represent a negligible proportion of all the deaths in the reference population.13
We calculated ES with the Ederer II method, which considers individuals at risk until the corresponding patient dies or is censored.14 There is growing consensus, especially among cancer registries when the follow-up time is less than 10 years, that Ederer II is the method of choice, given that other methods tend to overestimate survival.15,16 If ES was included within the 95%CI of the OS, no differences were considered to exist.
- 3.
Relative survival (RS): Calculation of RS was derived from the ratio of the OS in our sample of patients during a specific time interval to the ES of the reference group, which was free from the disease.14,17,18 In other words, RS is the survival expected in patients if they could only die from the main event or its consequences. In our sample, an RS of 100% would indicate that STEMI had no effect on survival in the study group. However, an RS of 90% would indicate that 10% of the patients died from the main event or its consequences. If the 95%CI of the RS included 100%, there would be no evidence of mortality due to STEMI. Therefore, the treatment provided effectively restored life expectancy to a level similar to that in the general population.
- 4.
Excess mortality (EM): EM refers to mortality among our patients due to the main event or its consequences under the premise that they could only die from STEMI. Its calculation is 1 − RS. A 10% EM indicates that 10% of the patients died from STEMI, and 0% EM indicates that none of the patients died from the event or its consequences. If its 95%CI includes 0, no statistically significant differences are considered to exist.7,19
All analyses were performed using STATA /IC 15.1 (STATA Corp, United States). The “strs” command by Dickman et al.14 was used to estimate the OS, ES, and RS.
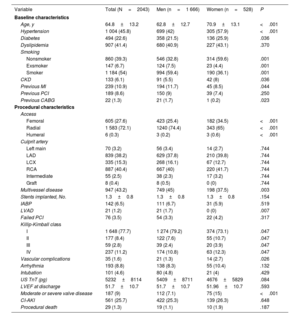
RESULTSBaseline characteristicsFrom January 2014 to October 2021, 2501 patients were diagnosed with STEMI and referred to our hospital. After exclusion of 307 patients because they did not undergo primary PCI, 2194 patients were included in the analysis. The mean age was 64.8±13.2 years, and 528 patients were female (23.9%); 194 (36.7%) were aged ≤ 65 years and 334 (63.3%)> 65 years. Compared with men, women were older (70.9±13.1 vs 62.8±12.7; P <.001) and had higher rates of hypertension (57.9% vs 42%) and chronic kidney disease (8% vs 5.5%; P=.036). Conversely, women had lower rates of previous myocardial infarction (8.5% vs 11.7%; P=.001) and smoking (36.1% vs 59.7%; P=.001). The remaining baseline characteristics are shown in table 1.
Baseline and procedural characteristics
| Variable | Total (N=2043) | Men (n=1 666) | Women (n=528) | P |
|---|---|---|---|---|
| Baseline characteristics | ||||
| Age, y | 64.8±13.2 | 62.8±12.7 | 70.9±13.1 | <.001 |
| Hypertension | 1 004 (45.8) | 699 (42) | 305 (57.9) | <.001 |
| Diabetes | 494 (22.6) | 358 (21.5) | 136 (25.9) | .036 |
| Dyslipidemia | 907 (41.4) | 680 (40.9) | 227 (43.1) | .370 |
| Smoking | ||||
| Nonsmoker | 860 (39.3) | 546 (32.8) | 314 (59.6) | .001 |
| Exsmoker | 147 (6.7) | 124 (7.5) | 23 (4.4) | .001 |
| Smoker | 1 184 (54) | 994 (59.4) | 190 (36.1) | .001 |
| CKD | 133 (6.1) | 91 (5.5) | 42 (8) | .036 |
| Previous MI | 239 (10.9) | 194 (11.7) | 45 (8.5) | .044 |
| Previous PCI | 189 (8.6) | 150 (9) | 39 (7.4) | .250 |
| Previous CABG | 22 (1.3) | 21 (1.7) | 1 (0.2) | .023 |
| Procedural characteristics | ||||
| Access | ||||
| Femoral | 605 (27.6) | 423 (25.4) | 182 (34.5) | <.001 |
| Radial | 1 583 (72.1) | 1240 (74.4) | 343 (65) | <.001 |
| Humeral | 6 (0.3) | 3 (0.2) | 3 (0.6) | <.001 |
| Culprit artery | ||||
| Left main | 70 (3.2) | 56 (3.4) | 14 (2.7) | .744 |
| LAD | 839 (38.2) | 629 (37.8) | 210 (39.8) | .744 |
| LCX | 335 (15.3) | 268 (16.1) | 67 (12.7) | .744 |
| RCA | 887 (40.4) | 667 (40) | 220 (41.7) | .744 |
| Intermediate | 55 (2.5) | 38 (2.3) | 17 (3.2) | .744 |
| Graft | 8 (0.4) | 8 (0.5) | 0 (0) | .744 |
| Multivessel disease | 947 (43.2) | 749 (45) | 198 (37.5) | .003 |
| Stents implanted, No. | 1.3±0.8 | 1.3±0.8 | 1.3±0.8 | .154 |
| IABP | 142 (6.5) | 111 (6.7) | 31 (5.9) | .519 |
| LVAD | 21 (1.2) | 21 (1.7) | 0 (0) | .007 |
| Failed PCI | 76 (3.5) | 54 (3.3) | 22 (4.2) | .317 |
| Killip-Kimball class | ||||
| I | 1 648 (77.7) | 1 274 (79.2) | 374 (73.1) | .047 |
| II | 177 (8.4) | 122 (7.6) | 55 (10.7) | .047 |
| III | 59 (2.8) | 39 (2.4) | 20 (3.9) | .047 |
| IV | 237 (11.2) | 174 (10.8) | 63 (12.3) | .047 |
| Vascular complications | 35 (1.6) | 21 (1.3) | 14 (2.7) | .026 |
| Arrhythmia | 193 (8.8) | 138 (8.3) | 55 (10.4) | .132 |
| Intubation | 101 (4.6) | 80 (4.8) | 21 (4) | .429 |
| US TnT (pg) | 5232±8114 | 5409±8711 | 4676±5829 | .084 |
| LVEF at discharge | 51.7±10.7 | 51.7±10.7 | 51.96±10.7 | .593 |
| Moderate or severe valve disease | 187 (9) | 112 (7.1) | 75 (15) | <.001 |
| CI-AKI | 561 (25.7) | 422 (25.3) | 139 (26.3) | .648 |
| Procedural death | 29 (1.3) | 19 (1.1) | 10 (1.9) | .187 |
CABG, coronary artery bypass grafting; CI-AKI, contrast-induced acute kidney injury; CKD, chronic kidney disease; IABP, intra-aortic balloon pump; LAD, left anterior descendant artery; LCX, left circumflex artery; LM, left main artery; LVEF, left ventricular ejection fraction; MI, myocardial infarction; PCI, percutaneous coronary intervention; RCA, right coronary artery.
Data are expressed as No. (%) or mean±standard deviation.
Significant differences were found in the procedure. Women more frequently required femoral access (34.5% vs 25.4%; P <.001), had higher rates of vascular complications (2.7% vs 1.3%, P=.026), moderate or severe valvular disease (15% vs 7.1%; P <.001), and consulted with worse hemodynamic status (Killip-Kimball ≥ II 27% vs 20.8%, P <.001). However, women less frequently had multivessel disease (37.5% vs 45%; P=.003) with a lower peak of high-sensitivity cardiac troponin T (HS-cTnT) (4676 vs 5409 pg/mL; P=.08). The remaining characteristics are shown in table 1.
Medical treatment at discharge was similar in both sexes and followed the recommendations of the latest clinical guidelines ().
Almost one fifth of mortality occurred in the first 30 days. In this period, crude mortality was lower in women (7.4% vs 10.4; P=.03). After this period, mortality was more frequent in women, with 10.7% at 1 year and 26.5% at the end of the follow-up; the percentages for men were 10.7% and 19.7%, respectively. The most frequent cause of death was acute myocardial infarction, representing almost half of the events. Details on mortality and causes of death are shown in .
Despite these differences in crude mortality, when adjustment was performed by age and risk factors, sex was not a predictor of death in our multivariable Cox regression analysis (HR, 0.98; 95IC%, 0.8-1.3) with an adequate model with a Harrel c index of 0.83. The factors significantly predicting death were age, chronic kidney disease, HS-cTnT level, left ventricular ejection fraction, contrast-induced acute kidney injury, and Killip-Kimball classification. Univariate and multivariable analyses are shown in .
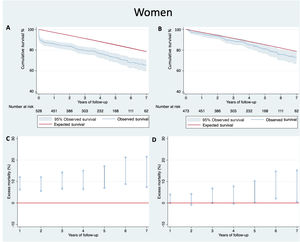
Observed and expected survivalThe mean follow-up was 4.1±2.5 years, with a total of 140 deaths (26.5%) in women and 329 (19.7%) in men (). Cumulative survival in women at 1, 5, and 7 years of follow-up was 88.5% (95%CI, 85.4-90.9), 75.2% (95%CI, 70.6-79.1), and 67.6% (95%CI, 61.6%-72.8) and the ES for the general population was 97%, 85.1%, and 75.6%, respectively. After exclusion of women not surviving the first 30 days, cumulative survival at 1, 5, and 7 years was 95.6% (95%CI, 93.3-97.1), 81.2% (95%CI, 76.6-85), and 73% (95%CI, 66.8-78.3) and the ES for the general population was 97.1%, 85.2%, and 76.6%, respectively. The OS and ES for all women are shown in figure 1A shows and those in women surviving the first 30 days are shown in figure 1B.

A: observed mortality with 95%CI and expected survival in the reference population in women of all ages. B: observed mortality with 95%CI and expected survival in the reference population of women of all ages who survived the first 30 days. C: excess mortality in women of all ages. D: excess mortality in women of all ages who survived the first 30 days. 95%CI, 95% confidence interval.
The cumulative EM in women of all ages surviving the first 30 days was 1.6% (95%CI, 0.3-4) in the first year, 4.7% (95%CI, 0.3-10.1) in the fifth year, and 7.2% (95%CI, 0.5-15.1) in the seventh year. The EM in all women is shown in figure 1C and that in women surviving the first 30 days is shown in figure 1D. Details are shown in table 2.
Observed survival, expected survival, and excess mortality in women of all ages and those surviving the first 30 days
| Year of follow-up | Cumulative survival of patients with STEMI (observed survival) (95%CI) | Cumulative survival in the reference group (expected survival) | Cumulativeexcess mortality (95%CI) |
|---|---|---|---|
| All women | |||
| First year | 88.5 (85.4 to 90.9) | 97 | 8.8 (6.3 to 12) |
| Second year | 86.2 (82.8 to 88.9) | 94.2 | 8.5 (5.6 to 12) |
| Third year | 82 (78.3 to 85.2) | 91.3 | 10.1 (6.7 to 14.3) |
| Fourth year | 79 (75 to 82.5) | 88.2 | 10.4 (6.4 to 15.1) |
| Fifth year | 75.2 (70.5 to 79.1) | 85.1 | 11.7 (7 to 17.1) |
| Sixth year | 70 (64.6 to 74.7) | 81.9 | 14.6 (8.8 to 21.2) |
| Seventh year | 67.6 (61.6 to 72.8) | 78.6 | 14 (7.4 to 21.6) |
| Year of follow-up | Cumulative survival of patients with STEMI (observed survival) (95%CI) | Cumulative survival in the reference group (expected survival) | Cumulativeexcess of mortality (95%CI) |
|---|---|---|---|
| Women surviving 30 d | |||
| First year | 95.6 (93.3 to 97.1) | 97.1 | 1.6 (0.3 to 4) |
| Second year | 93.1 (90.3 to 95.1) | 94.3 | 1.3 (−0.9 to 4.1) |
| Third year | 88.6 (85.2 to 91.3) | 91.4 | 3 (0.1 to 6.8) |
| Fourth year | 85.3 (81.4 to 88.5) | 88.3 | 3.3 (−0.3 to 7.7) |
| Fifth year | 81.2 (76.6 to 85) | 85.2 | 4.7 (0.3 to 10.1) |
| Sixth year | 75.6 (70 to 80.3) | 82 | 7.8 (2.1 to 14.7) |
| Seventh year | 73 (66.8 to 78.3) | 78.7 | 7.2 (0.5 to 15.2) |
95%CI, 95% confidence interval.
Data are expressed as No. (%).
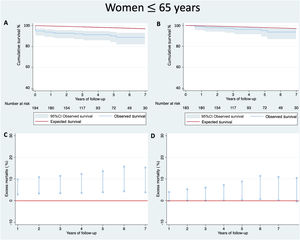
Among women aged ≤ 65 years surviving the first 30 days, there was a slight cumulative EM of 0.7% (95%CI, −0.1 to 4) in the first year, 3.1% (95%CI, 0.4 to 8.9) in the fifth year, and 3.8% (95%CI, 0.2 to 10.9) in the seventh year. The EM for all women is shown In figure 2C and that in women surviving the first 30 days is shown in figure 2D. Details on OS and ES are shown in table 3.

A: observed mortality with 95%CI and expected survival in the reference population of women aged ≤ 65 years. B: observed mortality with its 95%CI and expected survival in the reference population of women ≤ 65 years who survived the first 30 days. C: excess mortality in women aged ≤ 65 years. D: excess mortality in women aged ≤ 65 years who survived the first 30 days. 95%CI, 95% confidence interval.
Observed survival, expected survival, and excess mortality in women ≤ 65 years and those surviving the first 30 days
| Year of follow-up | Cumulative survival of patients with STEMI (observed survival) (95%CI) | Cumulative survival in the reference group (expected survival) | Cumulativeexcess of mortality(95%CI) |
|---|---|---|---|
| All women aged ≤ 65 y | |||
| First year | 94.3 (89.9 to 96.8) | 99.6 | 5.4 (2.9 to 9.8) |
| Second year | 93.2 (89.5 to 96) | 99.3 | 6.2 (3.3 to 10.8) |
| Third year | 92.5 (87.6 to 95.5) | 98.9 | 6.5 (3.4 to 11.4) |
| Fourth year | 91.6 (86.2 to 94.9) | 98.4 | 7 (3.6 to 12.3) |
| Fifth year | 90.5 (84.6 to 94.2) | 98 | 7.7 (3.9 to 13.6) |
| Sixth year | 89 (82.2 to 93.3) | 97.5 | 8.7 (4.3 to 15.7) |
| Seventh year | 89 (82.2 to 93.3) | 97 | 8.3 (3.8 to 15.3) |
| Year of follow-up | Cumulative survival of patients with STEMI (observed survival) (95%CI) | Cumulative survival in the reference group (expected survival) | Cumulativeexcess mortality (95%CI) |
|---|---|---|---|
| Women aged ≤ 65 y who survived 30 d | |||
| First year | 98.9 (95.7 to 99.7) | 99.6 | 0.7 (−0.1 to 4) |
| Second year | 97.7 (94.1 to 99.1) | 99.3 | 1.5 (0.1 to 5.2) |
| Third year | 97 (92.9 to 98.8) | 98.9 | 1.9 (0.1 to 6) |
| Fourth year | 97 (91.4 to 98.3) | 98.4 | 2.4 (0.2 to 7.2) |
| Fifth year | 94.9 (89.3 to 97.6) | 98 | 3.1 (0.4 to 8.9) |
| Sixth year | 93.4 (86.4 to 96.8) | 97.5 | 4.3 (0.7 to 11.4) |
| Seventh year | 93.4 (86.4 to 96.8) | 97 | 3.8 (0.2 to 10.9) |
95%CI, 95% confidence interval.
Data are expressed as No. (%).
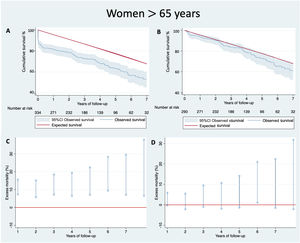
In women aged> 65 years surviving the first 30 days, there was no cumulative EM (95%CI, −0.3 to 5.9) at 1 year, 5.7% (95%CI, −1.3 to 14.1) at 5 years, and 9.6% (95%CI, −1.49 to 22.6) at 7 years. figure 3C shows the EM for all women and figure 3D shows that in women surviving the first 30 days. Details on OS and ES are shown in table 4.

A: observed mortality with 95%CI and expected survival in the reference population of women aged> 65 years. B: observed mortality with 95%CI and expected survival in the reference population of women aged> 65 years who survived the first 30 days. C: excess mortality in women aged> 65 years. D: excess mortality in women ≤ 65 years who survived the first 30 days. 95%CI, 95% confidence interval.
Observed survival, expected survival, and excess mortality in women aged> 65 years and those surviving the first 30 days
| Year of follow-up | Cumulative survival of patients with STEMI (observed survival) (95%CI) | Cumulative survival in the reference group (expected survival) | Cumulativeexcess mortality (95%CI) |
|---|---|---|---|
| All women aged> 65 y | |||
| First year | 85 (80.5 to 88.4) | 95.4 | 11 (7.3 to 15.6) |
| Second year | 82 (77.3 to 85.8) | 91 | 9.9 (5.7 to 15.1) |
| Third year | 75.9 (70.7 to 80.4) | 86.6 | 12.3 (7.2 to 18.4) |
| Fourth year | 71.8 (66.2 to 76.7) | 82 | 12.4 (6.5 to 19.4) |
| Fifth year | 66.5 (60.2 to 72.1) | 77.6 | 14.2 (7.1 to 22.3) |
| Sixth year | 59.4 (52.1 to 65.9) | 72.7 | 18.4 (9.4 to 28.3) |
| Seventh year | 55.7 (47.7 to 62.9) | 67.3 | 17.8 (7.1 to 29.5) |
| Year of follow-up | Cumulative survival of patients with STEMI (observed survival) | Cumulative survival in the reference group (expected survival) | Cumulativeexcess mortality |
|---|---|---|---|
| Women aged> 65 y who survived 30 d | |||
| First year | 93.5 (89.9 to 95.8) | 95.5 | 2.2 (−0.3 to 5.9) |
| Second year | 90.2 (86.1 to 93.1) | 91.1 | 1 (−2.2 to 5.5) |
| Third year | 83.5 (78.5 to 87.5) | 86.7 | 3.6 (−0.9 to 9.5) |
| Fourth year | 79 (73.3 to 83.6) | 82.1 | 3.8 (−1.9 to 10.7) |
| Fifth year | 73.2 (66.7 to 78.7) | 77.6 | 5.7 (−1.3 to 14.1) |
| Sixth year | 65.3 (57.5 to 72) | 72.8 | 10.3 (1.1 to 20.9) |
| Seventh year | 61.3 (52.6 to 68.8) | 67.8 | 9.6 (−1.5 to 22.4) |
95%CI, 95% confidence interval.
Data are expressed No. (%).
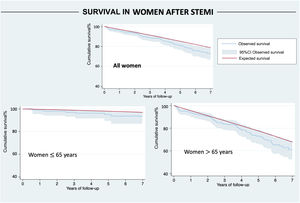
The main findings of this analysis were that women of all ages with a median follow-up of more than 4 years had elevated EM mainly from deaths occurring in the first 30 days. When we included only patients who survived the main event, EM was significantly reduced but persisted until the seventh year. When we stratified the analysis by age, the results were similar, with women aged ≤ 65 years showing even lower rates of EM but without recovering the same life expectancy as that in the general population. Conversely, women aged> 65 years who survived the main event did not show significant EM compared with the general population, indicating that primary PCI and medical treatment were sufficiently effective to allow them to recover their life expectancy (figure 4).

Previous analyses have associated sex as a predictor of mortality within the first year.5,6 However, a similar comparison of older women with a mean follow-up of 34.6 months reported that they recovered life expectancy if treated with primary PCI and survived the main event.8 Our findings have direct clinical implications since survival varies not only by sex but is reduced in women of all ages, especially in younger women. Therefore, increased efforts to improve early identification of STEMI and improve care times are of the utmost importance to ameliorate the effects of 30-day mortality, directly affecting women's life expectancy.
Data on the impact of STEMI on women are still conflicting regarding mortality and survival after the main event. Most information usually includes data from men, non-STEMI patients, and short follow-up periods.5,20,21 Moreover, survival compared with the general population matched by age, sex, and geographical region has been limited to women older than 75 years and all-comers, including men.7,8 Therefore, the findings of our study are highly significant in filling this knowledge gap and could be used to improve the quality of care of women undergoing primary PCI.
In our study, we took advantage of a prospectively collected STEMI database in a high-volume referral center and matched our sample with women of the same age and geographical region to compare life expectancy using the mortality tables of the INE.9 Patients were treated according to the latest clinical guidelines and with primary PCI by experienced operators.3,22
Women aged ≤ 65 yearsBecause the incidence of STEMI is low in women aged ≤ 65 years, they are the most underrepresented group in clinical trials and large-scale registries. ES in the reference group after 7 years was less than 3%. Therefore, any life-changing event, like STEMI, modifies prognosis. Cumulative EM at 7 years was almost 8%. After inclusion of patients surviving the first 30 days, the OS and ES curves tended to converge but showed an EM of less than 4% by the seventh year of follow-up. Of interest, mortality was lower in the first 4 years, at less than 2.5%, and there was a tendency toward higher EM after the fifth year. These results are similar to those of modern-era registries and analyses showing scarce mortality after the implementation of emergent reperfusion therapies and guideline-directed secondary prevention.23,24
The findings in women aged ≤ 65 years are arguably the most important of our study. Because of the potential years of life lost in younger patients and the detrimental effect of a life-changing event such as STEMI, it is crucial to compare mortality in these patients with that in a reference population in order to determine the most vulnerable periods to intensify treatments and to instigate early attention. In this sample of patients, the first 30 days carried a dismal prognosis, while 30-day survivors showed a peak in mortality in the fifth year.
Women aged> 65 yearsMortality was higher in this group than in younger patients, with almost 50% mortality during follow-up. Mortality in the reference group was also elevated, with an ES of 62.8% during this period. Among survivors of the main event, the OS and the ES curves converged from the first year of follow-up. When we analyzed EM from the first year, the 95%CI included 0, and no statistical differences were considered to exist. These noteworthy results could indicate that life expectancy in this sample of women is similar to that in the general population, as if STEMI had no effect on survival. After the first year, RS remained stable until the end of the follow-up.
Sex as a predictor of mortalityLike other reports, this study found that crude mortality was higher in women than in men. However, when we included age and risk factors, sex did not appear to be a predictor of mortality in our sample. Similar results were reported by Cenko et al.5 for short-term mortality and by Piackova et al.25 for long-term mortality, in which, in absolute numbers, sex was associated with mortality. Nevertheless, after correction for age and comorbidities, this difference disappeared.
LimitationsThis observational retrospective analysis is only applicable to the study population from a single center of a region in Spain. Caution should be exercised when extrapolating its results. The study was powered for the primary endpoint and when we stratified the sample by women aged ≤ and> 65 years, the sample size was relatively small. However, a factor to consider is the low incidence of STEMI in women.
CONCLUSIONSDespite medical advances in reperfusion therapies and treatments, life expectancy is lower in women with STEMI than in the general population of the same age and geographic area and is influenced by mortality in the first 30 days.
After exclusion of patients not surviving the main event, women of all ages had reduced EM but did not recover a similar life expectancy to that of the general population of the same age and geographical area.
EM was low in women aged ≤ 65 years, being only 5%; however, EM did not entirely disappear during follow-up. Conversely, if women aged> 65 years survived the main event, their life expectancy was similar to that in the reference population.
As in other international registries, sex was not an independent predictor for mortality after adjustment by age and risk factors.
FUNDINGNone.
AUTHORS’ CONTRIBUTIONSConception and design, writing the original draft: M. Almendárez, R. Alvarez-Velasco. Conceptualization, writing the draft and final approval: I. Pascual, P. Avanzas. Writing the draft and critical revision: A. Alperi, L. Gutiérrez. Critical revision and interpretation of the data: C. Moris de la Tassa, D. Hernández Vaquero, R. Lorca. Data collection and interviewing the patients: J. Martínez, D. Ledesma, L. Arboine.
CONFLICTS OF INTERESTP. Avanzas is associate editor of Rev Esp Cardiol. The journal's editorial procedure to ensure impartial handling of the manuscript was followed. The remaining authors have no conflicts of interest to declare.
- -
Older women have high mortality after STEMI.
- -
Mortality during the first 30 days influences women's long-term prognosis.
- -
Women aged> 75 years treated with primary PCI who survive the first 30 days can recover life expectancy similar to the general population of the same age and region.
- -
EM was higher than 10% in women of all ages treated with primary PCI compared with the general population.
- -
EM was significantly reduced in women surviving the acute event but did not disappear during follow-up.
- -
Life expectancy was improved in women aged ≤ 65 years who survived the first 30 days after STEMI but remained lower than that in the general population of the same age.
- -
Life expectancy in women aged> 65 years treated with primary PCI and surviving the acute event was similar to that in the general population of the same age.
Supplementary data associated with this article can be found in the online version, at https://doi.org/10.1016/j.rec.2023.04.003